Asset Management
The Bond Market in 2026: What Could Go Wrong?

Key takeaways
- We expect another generally good year for bonds in 2026, although returns might not be as robust as they were last year.
- We expect the yield curve to continue to steepen with only one or two more rate cuts this year by the Federal Reserve.
- Starting yields are lower and we see less room for bond yields to fall (and bond prices to rise) as an expected resilient economy likely will limit the scope for Fed rate cuts.
- Risks to our outlook include inflation surprises (to the upside or downside), a weaker-than-expected economy, changes at the Federal Reserve and geopolitical events.
- Our "base case" calls for steady economic growth and persistent inflation, but it's always important to consider alternative scenarios and how they may impact investments.
It was a good year for most bond investments in 2025. High starting yields, price appreciation for high-quality bonds, and a downtrend in yields led by Federal Reserve rate cuts combined to produce strong returns.
Coupon income was the key driver of total returns for many bond investments in 2025
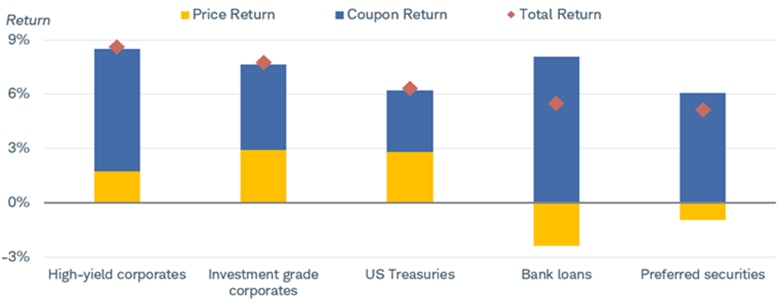
Source: Bloomberg. Total returns from 12/31/2024 through 12/31/2025.
Indexes representing the investment types are: High-yield corporates = Bloomberg US Corporate High Yield Index; Investment grade corporates = Bloomberg Investment Grade Corporate Index; US Treasuries = Bloomberg US Treasury Index; Bank loans = Bloomberg US Leveraged Loan Index; Preferred securities = ICE BofA Fixed Rate Preferred Securities Index. Indexes are unmanaged, do not incur management fees, costs, and expenses, and cannot be invested in directly. Past performance is no guarantee of future results.
We expect another good year in 2026, although returns might not be as robust as they were last year. Starting yields are lower, and we see less room for yields to fall (and prices to rise) as an expected resilient economy likely will limit the scope for Fed rate cuts.
We expect the yield curve to continue to steepen. The Federal Reserve lowered interest rates three times in 2025 but is expected to cut only one or two more times this year. That should pull short- and intermediate-term Treasury yields lower, but the 10-year Treasury yield should hold near 4% given sticky inflation, an expected increase in Treasury supply to finance federal deficits and rising global bond yields.
But even the best-laid plans can go awry when circumstances change. The year has already started off with a bout of volatility and there are plenty of potential catalysts for more. Consequently, we have compiled a list of what could go wrong and what it would mean for bond markets.
1. Upside or downside surprises to inflation. After peaking in 2022, inflation has been trending lower, but the downward progress has stalled a bit lately. The 12-month change in the headline Consumer Price Index (CPI) has held between 2.3% and 3.5% since the beginning of 2024; the 12-month change in core CPI, which excludes volatile food and energy prices, held at 2.6% in December after moderating in November, but prior to that had held between 2.8% and 3.4% for 17 straight months.
Inflation has generally held in a range since coming off the 2022 peak
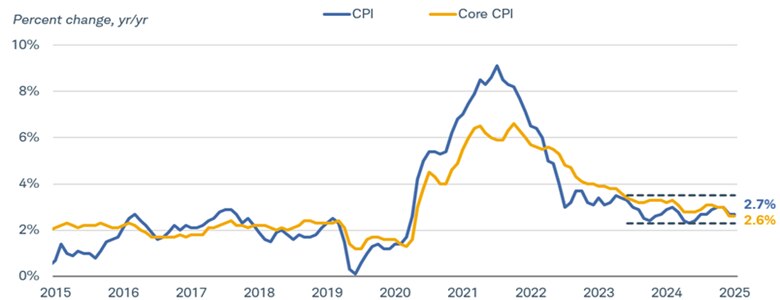
Source: Bloomberg. Monthly data from /12/31/2015 to 12/31/2025.
Consumer Price Index for All Urban Consumers: All Items Less Food & Energy (CPI XYOY Index) and Consumer Price Index for All Urban Consumers: All Items (CPI YOY Index). Indexes are unmanaged, do not incur management fees, costs, and expenses and cannot be invested in directly. Past performance is no guarantee of future results.
We expect inflation to remain a bit sticky, holding above the Fed's 2% target, for the near term given the resilient economy, but there appear to be both risks to the upside and the downside.
A significant weakening of the labor market could pull inflation lower if it slows down consumer spending. The labor market picture has been a bit mixed lately, with the December unemployment rate falling to 4.4% to reverse some of the recent rise, but job growth remains tepid. On a three-month-average basis, nonfarm payroll gains have been negative since October. Lower inflation could result in more rate cuts, a flatter yield curve, and more potential price appreciation for Treasuries.
Nonfarm payroll gains have slowed
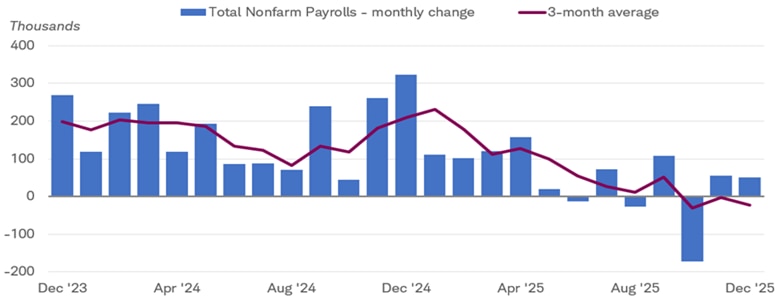
Source: Bloomberg. Monthly data from 12/31/2023 to 12/31/2025.
U.S. Employees on Nonfarm Payrolls, Total, MoM, Net Change SA (NFP TCH Index).
There are risks to the upside as well. Fed easing has kept financial conditions easy, and fiscal stimulus from last year's "One Big Beautiful Bill Act" could support a pickup in consumer spending. Tariffs appear here to stay, even if the outlook for the legality of the International Emergency Economic Powers Act (IEEPA) is uncertain. While tariffs haven't necessarily driven headline inflation rates much higher, they have generally lifted the prices of imported consumer goods by varying degrees.
Meanwhile, consumer and business surveys suggest that price increases are still a concern. The prices-paid components in both the Institute for Supply Management (ISM) Manufacturing and Services surveys highlight this risk, as both indexes have increased from the recent lows. Treasury yields would likely rise if inflation were to reaccelerate, with long-term Treasury prices falling the most given their high interest-rate risk.
The prices paid indexes from the ISM Manufacturing and Services Surveys are both above their lows of the last few years
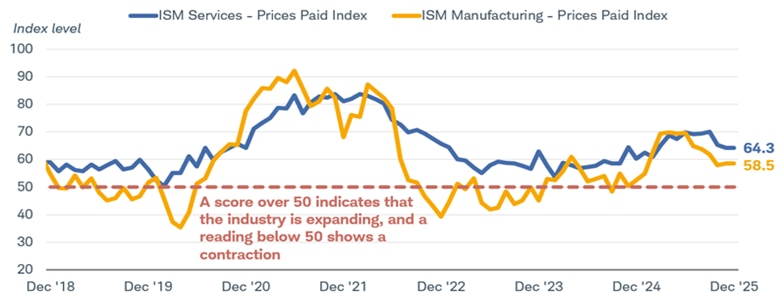
Source: Bloomberg. Monthly data from 12/31/2018 to 12/31/2025.
ISM Manufacturing Report on Business Prices Index NSA (NAPMPRIC Index) and ISM Services PMI Report on Business Prices SA (NAPMNPRC Index). The ISM Manufacturing Index is based on surveys of more than 300 manufacturing firms by the Institute of Supply Management. The ISM Manufacturing Index monitors employment, production inventories, new orders and supplier deliveries. A composite diffusion index is created that monitors conditions in national manufacturing, based on the data from these surveys. A score over 50 indicates that the industry is expanding, and a score below 50 shows a contraction.
2. A weaker economy. The recession that many feared when the Fed aggressively hiked rates in 2022-2023 never arrived, but risks are still present. Despite the strong headline growth, it's generally a bifurcated economy, often referenced as the "K-shaped" economy. Not everyone has benefitted from the above-trend growth over the last few years.
Slower growth would likely result in more Fed rate cuts and lower Treasury yields all across the curve. High-quality bond investments would likely benefit in this environment as lower yields would result in more price appreciation.
Riskier investments, like high-yield bonds and bank loans, would likely underperform in a slowing economy. Corporate profit growth would likely stall or turn negative, making it more difficult for highly indebted companies to remain current on their bond obligations. High-yield bond defaults have held near their long-term averages for the last two years, and they would likely edge higher.
The corporate bond markets aren't priced for slower growth ahead. Credit spreads—the extra yields that corporate bonds offer above comparable Treasuries—remain near their all-time lows, suggesting very little investor concern about the health of the economy or corporate balance sheets. If the outlook deteriorates, investors tend to demand higher relative yields to compensate for the potential credit losses if defaults do pick up. That pulls corporate bond prices lower relative to Treasuries.
High-yield spreads are close to the all-time lows
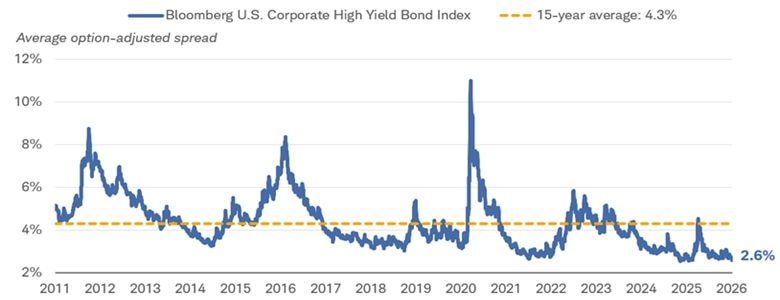
Source: Bloomberg, using daily data as from 1/8/2016 to 1/8/2026.
Option-adjusted spreads (OAS) are quoted as a fixed spread, or differential, over U.S. Treasury issues. OAS is a method used in calculating the relative value of a fixed income security containing an embedded option, such as a borrower's option to prepay a loan. An excess return is calculated for each security in the index as the difference between the security's total return and the total return on Treasuries in the corresponding duration cell. These excess returns are aggregated to the index level. Indexes are unmanaged, do not incur management fees, costs, and expenses and cannot be invested in directly. Past performance is no guarantee of future results.
We have a neutral outlook on high-yield bonds even if growth holds near its trend given the low relative yields. If economic growth were to slow, or worse, a recession arrived, high-yield bond and bank loans would likely underperform U.S. Treasuries.
3. Changes at the Fed. The beginning of each year brings the annual rotation of voters on the Federal Open Market Committee (FOMC). Governors are permanent voters, as is the president of the Federal Reserve Bank of New York who serves as the committee's vice chair, but district bank presidents vote on a rotating basis. While the two district presidents who dissented at the December FOMC meeting in favor of holding rates steady will rotate out of voting, two incoming voters appear to lean on the more hawkish side—Cleveland Fed President Beth Hammack and Dallas Fed President Lori Logan.
Potential changes to the Board of Governors may have more implications, however. Governor Stephen Miran's term ends at the end of January, and whoever fills that may become the Fed Chair once Jerome Powell's term ends at the end of May. President Donald Trump has made it clear he prefers a chair that shares his views on lower interest rates, so it's reasonable to assume that Miran's replacement will be more dovish than Powell.
While Powell's term as chair ends in May, his term as governor runs until January 2028. He hasn't disclosed his post-chair plans yet, and it's possible he will vacate his governor position later this year. Meanwhile, Governor Lisa Cook's future is in question as administration is attempting to remove her from her position.
The reported threat of a criminal investigation into the Federal Reserve muddies the outlook even more as it raises questions around both Federal Reserve independence and the outlook for new potential governor appointments. Following the announcement, Senator Thom Tillis stated that he will "oppose the confirmation of any nominee for the Fed—including the upcoming Fed Chair vacancy—until this legal matter is fully resolved." 1
There's plenty of uncertainty around the path of monetary policy as the dot plot below illustrates. There's a wide range of views among committee members, and it may be difficult to build consensus this year. But if we see turnover at the Board of Governors and the members are dovish, then the Fed would likely cut rates more than we and the markets currently expect.
There is a wide dispersion of views among Fed officials about the path of monetary policy
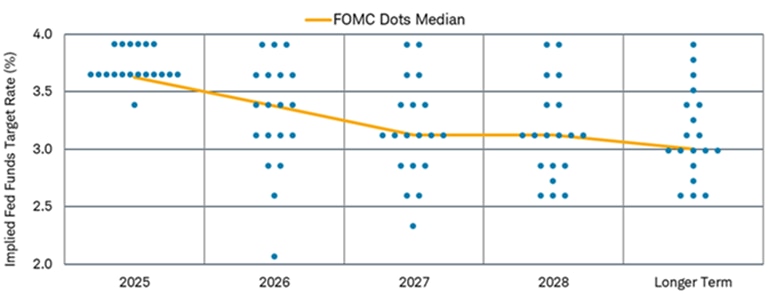
Source: Bloomberg. FOMC DOT Plot as of 12/10/2025.
The FOMC dot plot is a quarterly chart showing individual policymakers' anonymous forecasts for future federal funds rates, indicating where they expect the federal funds rate target to be over the next few years.
4. Geopolitical risks. The political outlook is unstable amid a number of policy changes. Domestically, the loss of subsidies for the Affordable Care Act and their impact on the government shutdown has been a source of dispute, along with immigration policies. In the global economy, the U.S. move to remove Venezuela's president has raised questions about future foreign policy moves.
While markets have handled the various international conflicts easily, the implications for oil prices, the U.S. dollar, economic growth, and the budget are a bit unknown. It would not be surprising to see future bouts of volatility due to the instability. Treasury market volatility, measured by the ICE BofA MOVE Index shown below, is near its four-year lows. Treasury yields could move up or down more than expected if volatility picks up this year.
Bond market volatility is near its four-year low
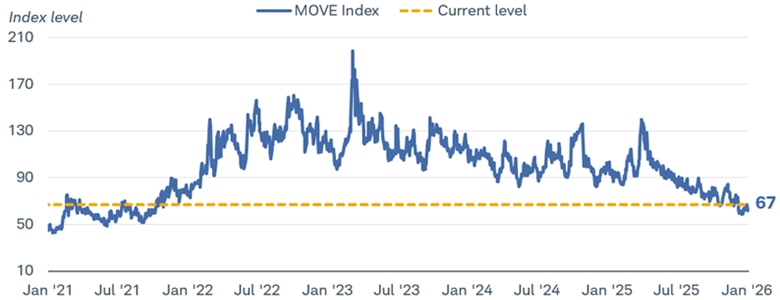
Source: Bloomberg. Daily data from 1/8/2021 to 1/8/2026.
Merrill Option Volatility Estimate (MOVE INDEX). Merrill Option Volatility Estimate is a yield curve weighted index of the normalized implied volatility on 1-month Treasury options. For illustrative purposes only. Indexes are unmanaged, do not incur management fees, costs, and expenses and cannot be invested in directly. Past performance is no guarantee of future results.
What investors can consider now
Our base case—what we believe to be the most realistic expected scenario—calls for steady growth and sticky inflation, but it's always important to consider alternative scenarios and how they may impact investments.
We suggest investors consider intermediate-term maturities—those with average yields in the four- to 10-year range—given our outlook for a steeper yield curve. Focusing too much on short-term investments introduces reinvestment risk as the Fed cuts rates, but focusing too much on long-term investments means high interest rate risk if yields rise due to sticky inflation or the increase in supply.
We continue to suggest an "up in quality" investment theme mainly due to valuations. Treasuries, agency mortgage-backed securities, and investment grade municipal and corporate bonds would fall under that umbrella. Investors can consider riskier investments in moderation, but their low relative yields mean there's little margin for error if the economy slows.
About the authors

Collin Martin