Asset Management
The Bond Market: Iran, Inflation & Interest Rates

Key Takeaways
- We expect Federal Reserve policy to stay on hold for several meetings, with the 10-year Treasury yield likely to remain in the 4% to 4.5% range over the short run. If oil prices stay elevated for longer and/or inflation expectations rise, yields may rise above that 4.5% upper threshold.
- Given the elevated inflation risk, we prefer intermediate-term maturities, those in the four- to 10-year range, rather than favoring long-term maturities.
- We suggest investors consider focusing on higher-quality bonds, while more aggressive investors can consider preferred securities for added income, recognizing their higher potential volatility and interest rate risk.
The Treasury market continues to be driven by the war in Iran and the subsequent rise in oil prices.
While last week's news of a two-week ceasefire initially helped pull Treasury yields lower, as an anticipated decline in oil prices could mean that the inflation increase might be more temporary than initially expected, that drop has already reversed on concerns that the truce won't hold. On April 13, Treasury yields (which move inversely to Treasury bond prices) were generally higher than they were before the April 7 announcement of a two-week ceasefire, highlighting that uncertainty remains high and Treasury yields may be driven by short-term headlines around the conflict and the direction of oil prices.
Treasuries and crude oil prices have been volatile lately
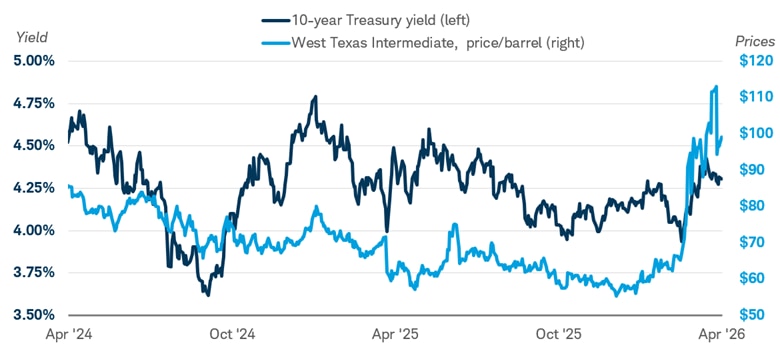
Source: Bloomberg. Daily data from 4/13/2024 to 4/13/2026.
U.S. Generic 10-year Treasury Yield (USGG10YR INDEX) and Generic 1st Crude Oil, WTI Index (CL1 Comdty). West Texas Intermediate (WTI) serves as a primary benchmark for oil pricing in North America. Past performance is no guarantee of future results. For illustrative purposes only.
We have revised our expectations for the path of Federal Reserve policy this year, but our broader fixed income outlook is mostly unchanged. The reason is simple: The current situation remains very fluid. Day-to-day changes in market expectations of the Fed have been driven more by developments in the conflict, and the resulting move in oil prices, than by underlying economic data.
Coming into the year, and prior to the conflict in the Middle East, we expected the Fed to lower rates one or two times by year-end. Now we expect just one cut, or no cut at all, by the December 2026 meeting. Put more simply, we expect the Fed to remain on hold for the next several meetings.
Market expectations around the path of monetary policy have fluctuated considerably since the war began. The chart below highlights the market's expected path of Fed policy over the next year. Earlier this year, the federal funds futures market was pricing in at least two interest rate cuts by the end of the year. By late March, the federal funds futures market suggested that a rate hike was more likely than a rate cut by year-end. By April 13, expectations shifted once again, with the relatively flat light blue line illustrating that market expectations currently point to no change in policy by the end of the year.
Market expectations for Fed rate cuts have changed
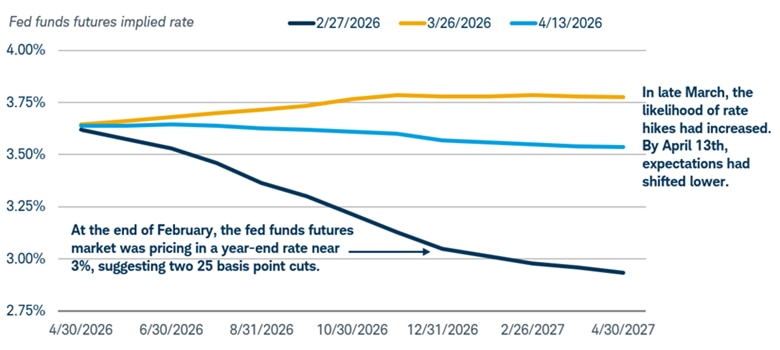
Source: Bloomberg and the Federal Reserve.
Market estimates as of 2/27/2026, 3/26/2026, and 4/13/2026.
Market estimate of the future federal funds rate using Fed Funds Futures Implied Rate. Futures and futures options trading involves substantial risk and is not suitable for all investors. Please read the Risk Disclosure Statement for Futures and Options prior to trading futures products. For illustrative purposes only. Past performance is no guarantee of future results.
The minutes of the March 2026 Federal Open Market Committee (FOMC) meeting suggested that the Fed was likely to remain on hold for the time being, as they highlighted that the vast majority of Fed officials judged that progress towards the committee's 2% inflation target could be slower than previously expected. Meanwhile, a couple participants had pushed back the potential rate cut timing given the expected hit to inflation from the rising oil prices.
Inflation had generally held above the Fed's target for five years, and core inflation readings have recently increased. The core Personal Consumption Expenditures (PCE) Index excludes volatile food and energy prices and is one of the Fed's preferred inflation gauges; it rose by 3.0% on a year-over-year basis in February, according to the Bureau of Economic Analysis.
PCE inflation remains above the Fed's 2% inflation target

Source: Bloomberg. Monthly data from 2/28/2016 to 2/28/2026.
PCE: Personal Consumption Expenditures Price Index (PCE DEFY Index), Core PCE: Personal Consumption Expenditures: All Items Less Food & Energy (PCE CYOY Index), percent change, year over year. The Personal Consumption Expenditures price index tracks price changes in consumer goods and services; "core PCE" excludes volatile food and energy prices.
While the situation is very fluid, the bar for a rate hike seems high, as the expected rise in inflation would be driven by an oil price shock rather than by stronger demand. On the idea of tighter policy, many Fed officials at the March 2026 FOMC meeting said that higher inflation for longer could support a case for interest rate hikes. This highlights that the price of oil, and how long it stays elevated, likely will be a key driver of Fed decisions as the year progresses.
The Fed can't lower oil prices, but it can manage inflation expectations. There are a number of ways to measure inflation expectations, including survey-based and market-based measures. Breakeven rates on Treasury Inflation-Protected Securities (TIPS), one market-based measure, have remained fairly well anchored so far (the breakeven rate—the difference in yield between a Treasury bond and a TIPS of the same maturity—reflects the average inflation rate needed for a TIPS to perform as well as a standard Treasury). Short-term (over the next year or two) inflation expectations have risen sharply, but intermediate- and long-term inflation expectations have only risen modestly, suggesting the Fed does not need to tighten policy.
TIPS breakeven rates have remained fairly steady
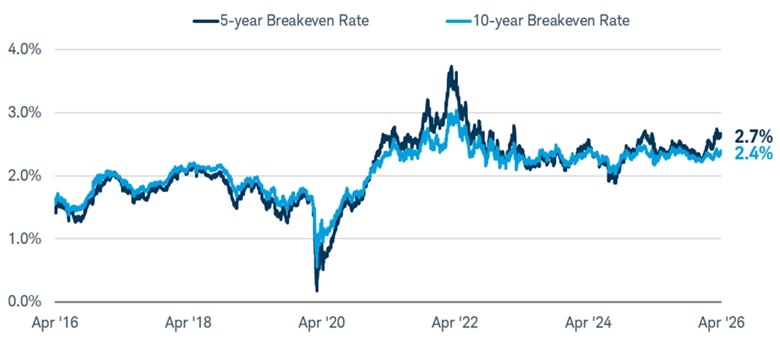
Source: Bloomberg. Daily data from 4/13/2016 to 4/13/2026.
U.S. Breakeven 5 Year (USGGBE05 Index) and U.S. Breakeven 10 Year (USGGBE10 Index). Past performance is no guarantee of future results.
The recent rise in Treasury yields is another reason why the Fed doesn't need to tighten policy in the face of higher expected inflation—the markets are doing the Fed's job for it. Although very short-term yields, like those on one- and three-month Treasury bills, are mostly unchanged, the yields on Treasuries with maturities of one year or more have risen by varying degrees. That tightens financial conditions as it raises the cost of borrowing.
Current Treasury yield curve in comparison to pre-Iran conflict
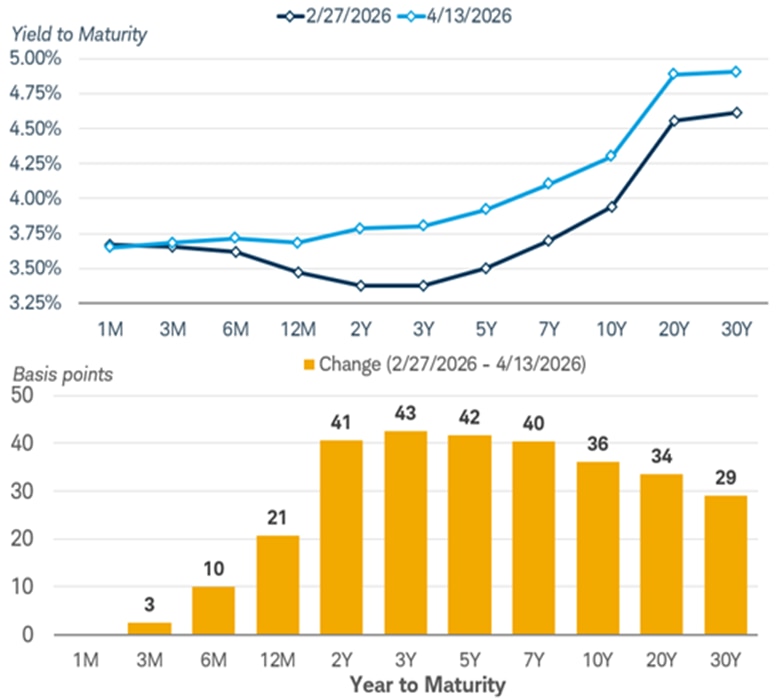
Source: Bloomberg. Data as of 2/27/2026 and 4/13/2026.
U.S. Treasury Actives Curve (GC C15). A basis point is a unit of measurement equal to 1/100th of one percent, or 0.01%. Past performance is no guarantee of future results.
The 10-year Treasury yield has traded in a range of 4% to 4.5% since the beginning of the conflict. While they fell modestly after the April 7 two-week ceasefire announcement, they have since risen on concerns that the truce may not hold. The longer the conflict goes on, the more likely inflation will remain elevated—or even moves higher—if oil prices stay high. That may prevent yields from falling materially further over the short run.
The factors that we expected to keep the 10-year Treasury yield elevated coming into the year are still present: sticky inflation, fiscal concerns, and the path of global bond yields.
Inflation was already sticky before oil prices moved higher. In March, the Consumer Price Index (CPI) posted its largest monthly increase since June 2022, at 0.9%, according to the Bureau of Labor Statistics. Core inflation also remains firm. As noted above, the core PCE index rose 3% year over year through February 2026.
Fiscal concerns were another driver of our 10-year Treasury yield outlook. The U.S. government continues to run a large budget deficit that needs to be financed by new Treasury issuance. Wars tend to be expensive, and we've already seen headlines about a higher expected defense budget. If Treasury supply needs to increase, yields should stay elevated, or maybe even rise a bit further, to attract new buyers.
Wars historically are inflationary
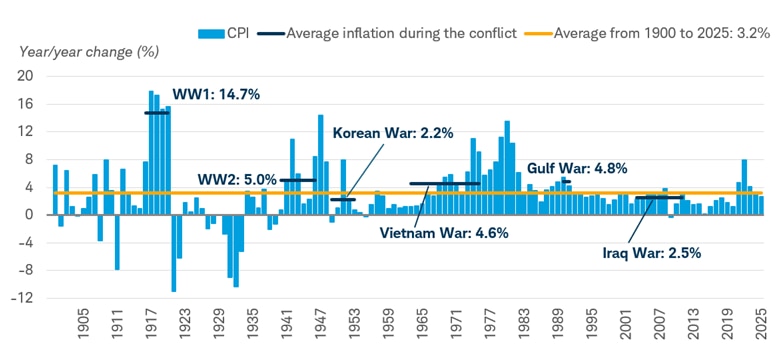
Source: Macrobond. Annual data from 12/31/1900 to 12/31/2025.
US CPI Urban Consumers Index (CPI Index), percent change, year over year.
Finally, global bond yields have risen lately, as well. While the Federal Reserve has a dual mandate of price stability and maximum employment, the European Central Bank (ECB) has a single mandate of price stability. With inflation expected to rise more in Europe than in the U.S., the ECB, and potentially the Bank of England, might raise rates in the coming months. The chart below highlights how many developed market government bond yields have risen since the start of the year, with United Kingdom and Japanese 10-year bond yields rising more than the U.S. 10-year Treasury yield. Rising global bond yields could establish some sort of floor for U.S. Treasury yields.
Year-to-date change in global 10-year yields
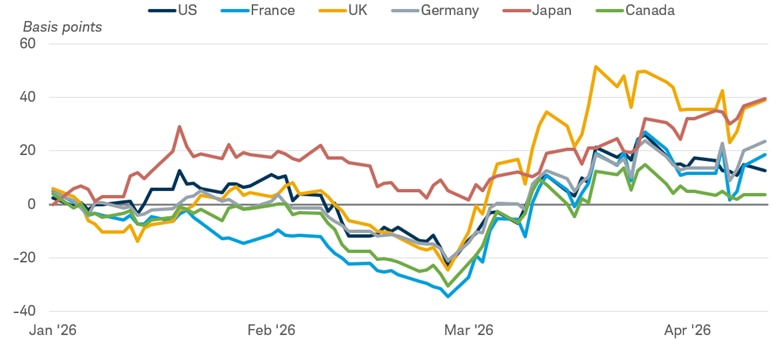
Source: Bloomberg. Data from 12/31/2025 to 4/13/2026.
Global 10-year Generic Govt bond yields. US (USGG10YR Index), France (GTFRF10Y Govt), U.K (GTGBP10Y), Germany (GTDEM10Y Govt), Japan (GTJPY10Y Govt), Canada (GTCAD10Y Govt). Past performance is no guarantee of future results.
With all three factors still supporting higher U.S. Treasury yields, we expect the 10-year Treasury yield to hold in the 4% to 4.5% range for the near term assuming no additional escalations in the Middle East. If oil prices stay elevated for longer and/or inflation expectations rise, yields may rise above that 4.5% upper threshold. Conversely, economic growth prospects would likely need to slow considerably for the 10-year Treasury yield to fall back below 4%. For now, the economy appears resilient.
What investors can consider now
Our outlook is mostly unchanged. We expect the Fed to remain on an extended pause and the 10-year Treasury yield to hold in the 4% to 4.5% range.
We suggest investors favor intermediate-term maturities, generally meaning average maturities in the four- to 10-year range. We're cautious about taking too much interest-rate risk with inflationary pressures still present, but there could be an opportunity down the road where longer-term bonds appear more attractive if the inflation outlook improves. In our view, we're not there yet, however.
Higher-rated bonds remain attractive as Treasuries, agency mortgage-backed securities, and investment-grade corporate and municipal bonds generally offer yields that weren't available from 2009 until early 2022. Uncertainty around the conflict in the Middle East could pull yields of these investments higher, potentially resulting in lower prices over the short run, however.
Investors willing to take a little extra risk might consider preferred securities, though they have high-interest rate risk and moderate credit risk, so we expect bouts of volatility. Their yields have risen even more than long-term Treasury yields since the beginning of the war, and while we're still a bit cautious about investors extending duration with traditional bonds, the balance of risk and reward looks more attractive, with the average yield-to-worst (the lowest possible yield a bondholder can receive from a bond with a call feature, barring default) of the ICE BofA Fixed Rate Preferred Securities Index near 6.3%.
About the author