
Asset Management
Fed Hikes: What's Next for Treasury Yields?

Key takeaways
- The Federal Reserve's September rate hike likely won't be its last. We expect at least one additional increase, while the pace and extent of further tightening will depend largely on inflation—especially monthly core readings and how broad any additional price increase may be.
- With inflation still elevated, the economy resilient, and the Fed more hawkish than expected, we now expect the 10-year Treasury yield to generally hold in a 4.5%–5% range—but it could move below or above that range for periods of time. Risks lean toward the upside, although a Fed committed to bringing inflation down could help limit a more significant increase.
- The recent move up in yields has presented an attractive opportunity for fixed income investors. We suggest continuing to favor short- and intermediate-term bonds over long-term bonds, but that doesn't mean hiding out in cash.
The Federal Reserve hiked rates. What might be next?
The Fed raised its benchmark interest rate to the 3.75% to 4% range at its September Federal Open Market Committee (FOMC) meeting, its first hike since July 2023. Projections from Fed participants suggest that at least one more hike is likely, and we agree.
The "why" behind the hike is clear: inflation has held above the Fed's 2% target for over five years, and with a resilient economy and a stable labor market, an adjustment seemed necessary to bring inflation down to target in a timely manner.
Expectations for higher short-term interest rates have likely been a key driver behind the recent rise in long-term Treasury yields. Ironically, Fed rate hikes may prevent long-term yields from rising much further if they help keep inflation expectations in check.
Last month, we revised our expected range for the 10-year Treasury yield up to the 4.25% to 4.75% level. The direction was right, but not the level. With the 10-year Treasury yield now near 5%, it seems unlikely that the 10-year yield will be back to the 4.25% level over the short-run.
When the facts change, we change our view. As such, we think the 10-year Treasury yield will hold in the higher 4.5% to 5% range for now, but there could be some additional upside given the economic resilience. There may be periods where the yield could move above that range—much like it has lately.
What might this mean for investors?
- Fed rate hikes should pull up the yields on short-term investments. The yields on Treasury bills, short-term certificates of deposit, and money market funds have a strong relationship with the fed funds rate.
- Unless the economic growth outlook deteriorates, a hawkish Fed may put some sort of floor on long-term Treasury yields. That supports the increase in our expected 10-year Treasury yield range.
- Although long-term yields are at or near their 19-year highs, we don't think now is the time to tactically be adding long-term bonds just yet. As such, we suggest investors continue to favor a below-benchmark average duration.
Below we'll explain why we think additional hikes seem likely, what's been driving long-term yields higher, and why we still favor a below-benchmark average duration (meaning below the Bloomberg US Aggregate Index's average duration of six years).
Fed hikes by 25 basis points and at least one more hike seems likely
The decision to raise rates was unanimous, with all 12 voting members voting in favor of a hike.
What comes next will depend on the inflation outlook. It seems that speed is the key issue here, and the committee wants to ensure that inflation returns to target in a timely manner. The dot plot shown below suggests that officials don't necessarily see the need for a prolonged and extended rate hiking cycle to achieve their target, and we agree. Following the September hike, we expect at least one additional rate hike by year-end, with one more possible later this year or sometime in 2027. Inflation trends will dictate if additional tightening is necessary.
The Fed's dot plot
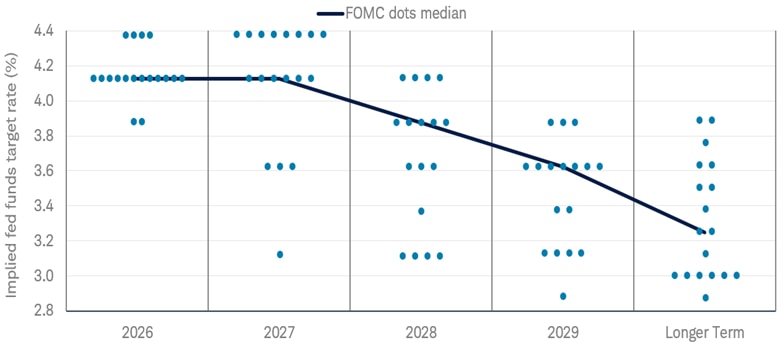
Source: Bloomberg. The FOMC dot plot, as of 9/16/2026.
Note: Each shaded circle indicates the value (rounded to the nearest 1/8 percentage point) of an individual participant's judgment of the midpoint of the appropriate target range for the federal funds rate or the appropriate target level for the federal funds rate at the end of the specified calendar year or over the longer run.
The dot plot is where officials provide their assessment of the appropriate level of monetary policy at the end of the next few years. Fed Chair Kevin Warsh has made it clear he's not a fan of the dot plot and has not submitted his own projections. The rest of the committee submitted their projections, however, and the median dot projects one more hike by year-end, with an extended hold next year. The balance of risks is tilted toward more hikes, rather than fewer, as eight participants projected another hike by the end of 2027.
The fed funds futures market is pricing in a more hawkish path for monetary policy, with nearly three additional rate hikes by next June priced in. Market participants may have latched on to Warsh's comment that the rate hike removed "a dose of accommodation," tacitly acknowledging that monetary policy was accommodative to begin with. That suggests more work may need to be done.
The fed funds futures market is pricing in more rate hikes than the dot plot
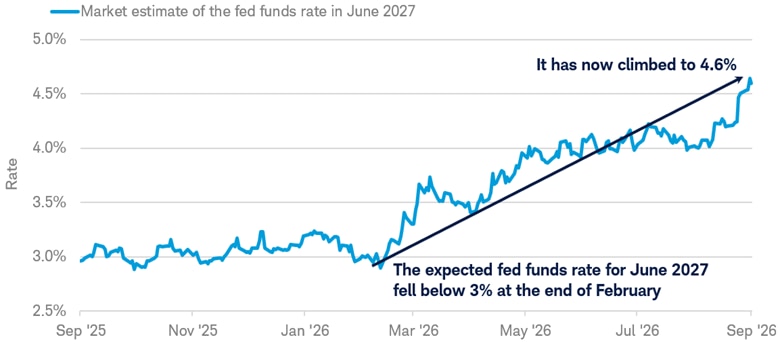
Source: Bloomberg.
Market estimate of the fed funds futures rate in June 2027 using Fed Funds Futures Implied Rate Index (US0AFR JUN2027 Index). Data from 9/17/2025 to 9/17/2026.
Futures and futures options trading involves substantial risk and is not suitable for all investors. Please read the Risk Disclosure Statement for Futures and Options prior to trading futures products. For illustrative purposes only.
We are more aligned with the median "dot" from the Fed, but we believe that the outlook is very uncertain. For the Fed to hike more than we expect, incoming inflation readings would likely need to come in on the strong side. Some key trends we'll be watching include:
- The monthly increases in core inflation. This is something New York Fed President John Williams has singled out, suggesting he'd need to see monthly readings of 0.2% or less to be confident that inflation is returning to the 2% target.
- The underlying breadth of price increases. Warsh has singled out the share of personal consumption expenditures (PCE) components rising above 3% on a year-over-year basis, which is shown in the chart below. If breadth improves while more headline-grabbing inflation indicators remain elevated, the Fed may be comfortable holding rates steady. If breadth doesn't improve, more hikes may come.
The share of PCE components rising by 3% or more annually has increased
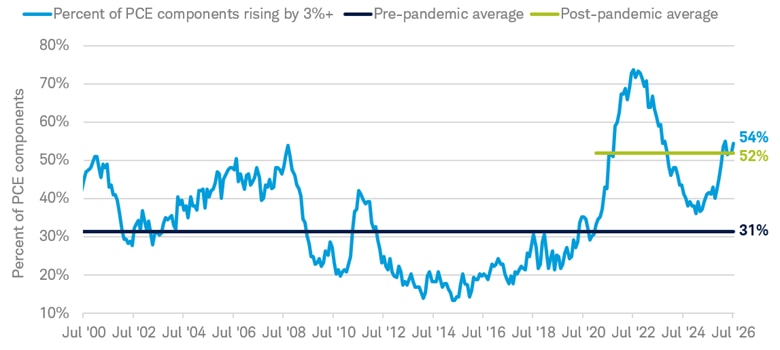
Source: Macrobond and the Bureau of Economic Analysis. Monthly data from July 31, 2000 through July 31, 2026.
Diffusion index reflects the share of the 204 Personal Consumption Expenditures subcomponents (BEA Table 2.4.4U categories, ex. margin, imputed, deduction, and abroad lines) with year-over-year price growth above 3%. Pre-pandemic average calculated from January 2000 through December 2019; post-pandemic average is calculated from January 2021 through July 2026.
Short-term yields are likely to rise with additional rate hikes. The yields on short-term investments, like Treasury bills (shown below) and money market funds, tend to track the fed funds rate closely.
The relationship between the fed funds rate and the 10-year Treasury yields is less direct, however. The 10-year Treasury yield is forward looking and tends to move in advance of potential changes in the fed funds rate, as we'll discuss below.
Treasury bills tend to track the fed funds rate, but the relationship is less direct for the 10-year Treasury yield
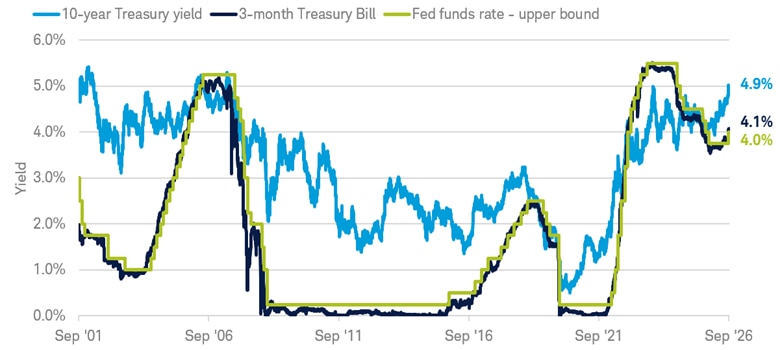
Source: Bloomberg.
U.S. Generic Govt 10 Yr (USGG10YR Index), U.S. Generic Govt 3 Mth (USGG3M Index), and Federal Funds Target Rate - Upper Bound (FDTR Index). Daily data from 9/17/2001 to 9/17/2026.
Indexes are unmanaged, do not incur management fees, costs, and expenses and cannot be invested in directly. Past performance is no guarantee of future results.
10-year Treasury yields: even higher for longer
We raised our outlook for the 10-year Treasury yield last month. Our theme was "higher for longer" and our new theme should be "even higher for longer."
The factors supporting our view last month are still at play. Inflation remains sticky, fiscal concerns aren't going away anytime soon, and the economy is still resilient. With the Fed now more hawkish than initially expected, we believe the 10-year Treasury yield will generally hold in the higher 4.5% to 5% range.
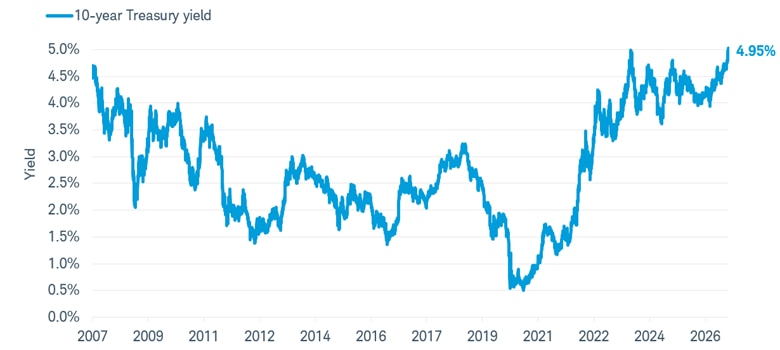
The 10-year Treasury yield is near a 19-year high
Source: Bloomberg.
Generic 10-year Govt bond yield (USGG10YR Index). Data from 9/17/2007 to 9/17/2026. Past performance is no guarantee of future results.
Through September 17, the 10-year Treasury yield is up roughly 80 basis points, or 0.8%, this year, which has made many headlines and has likely made many investors anxious. We believe the move up is justified given the relatively strong economic fundamentals. The fed funds rate is likely at or below "neutral," the economy is growing, and the labor market is stable. A positively sloped yield curve—one where long-term yields are above short-term yields—makes sense in that environment.
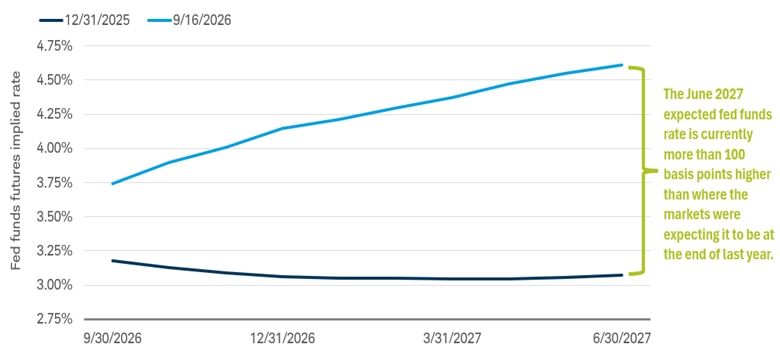
The hawkish Fed and a higher expected short-term rate appear to be the key drivers of the move up this year. The chart below sums it up clearly: the expected fed funds rate for June 2027 is now more than 150 basis points higher than where the markets expected it to be at the end of 2025. Put that way, an 80-basis-point increase in the 10-year Treasury yield seems reasonable.
Fed expectations
Source: Bloomberg and the Federal Reserve.
Market estimate of the fed funds futures rate using Fed Funds Futures Implied Rate (FFX3 COMB Comdty). Market estimates as of 12/31/2025 and 9/16/2026.
Futures and futures options trading involves substantial risk and is not suitable for all investors. Please read the Risk Disclosure Statement for Futures and Options prior to trading futures products.
For illustrative purposes only.
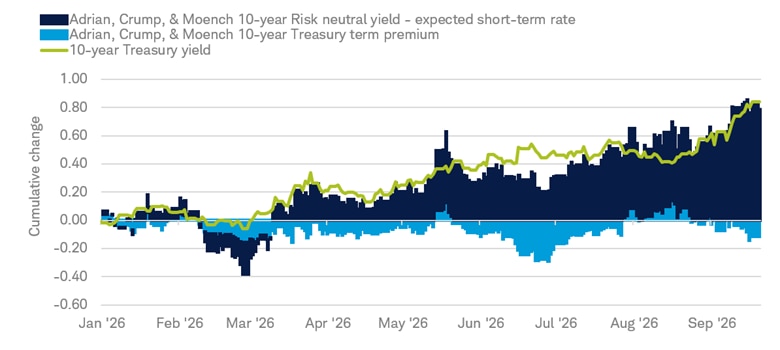
This chart below, courtesy of data from the Federal Reserve Bank of New York, helps explain that case as well. The Adrian, Crump, and Moench (ACM) model breaks down factors of the 10-year Treasury yield—it attributes the 10-year Treasury yield to the expected short-term interest rate and the "term premium." The term premium is defined as the compensation that investors require for bearing the risk that market interest rates may change over the life of the bond.
This chart highlights that most of the move up this year is due to the expected change in the short-term rate rather than the term premium. Unless the market begins to expect more rate hikes than the three the fed funds futures market currently implies, expected short-term yields might not pull long-term yields much higher.
Much of the year-to-date increase in the 10-year Treasury yield was driven by a higher expected short-term rate
Source: Bloomberg.
Adrian, Crump, and Moench 10-year Treasury term premium (ACMTP10 Index), Adrian, Crump, and Moench 10-year Risk neutral yield - expected short-term rate (ACMTRY10 Index), Generic 10-year Govt bond yield (USGG10YR Index). Data from 12/31/2025 to 9/15/2026. For illustrative purposes only.
The Adrian, Crump, and Moench 10-year Treasury term premium (ACMTP10 Index) is a New York Fed model estimate of the extra compensation investors require to hold a 10-year Treasury instead of rolling over short-term bonds.
Past performance is no guarantee of future results.
The Fed's rate hike and overall hawkish bias may help keep long-term yields from rising significantly higher. A Fed that's committed to fighting inflation can keep inflation expectations anchored. More importantly, a Fed that follows through on its hawkish posture can also help boost its credibility.
We do see more risks to the upside than the downside. For yields to move materially lower, the economic outlook would likely need to deteriorate. And while there appears to be more upside potential than downside potential for the 10-year Treasury yield, our base case is for yields to hold in a range, and upside potential to be limited.
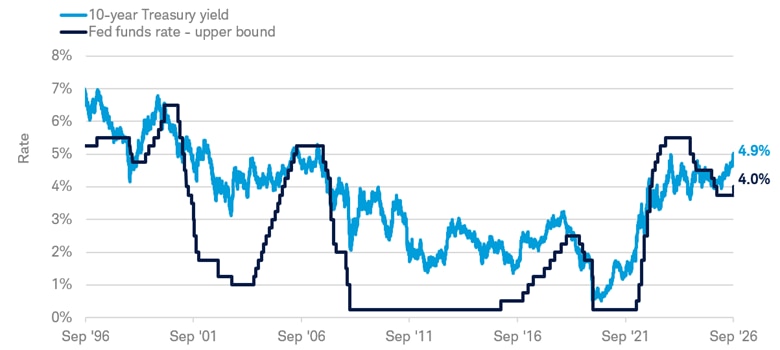
The relationship has changed over time, but historically, the 10-year Treasury yield tends to peak near the peak fed funds rate of a given cycle. That relationship broke down a bit during the last two cycles—it overshot the peak fed funds rate in 2018, then undershot it in 2023.
This may beg the question of why we're raising our expected trading range for the 10-year Treasury yield if the market is pricing in a fed funds futures rate of just 4.6% next year. With inflation still elevated, a resilient economy, and fiscal concerns potentially weighing on the bond market, the case can be made for the 10-year Treasury yield to hold a bit above that level for the time being. And historically, the 10-year Treasury yield tends to peak closer to the last rate hike of a given cycle, not the first.
In the past, the 10-year Treasury yield has peaked near the peak fed funds rate of a given cycle
Source: Bloomberg.
US Generic Govt 10 YR (USGG10YR Index), Federal Funds Target Rate – Upper Bound (FDTR Index). Daily data from 9/17/1996 to 9/17/2026. Past performance is no guarantee of future results.
What to consider now
The move up in bond yields has made many headlines and likely has many investors nervous about their bond portfolios. After all, bond prices and yields move in opposite directions, and that appears to be the risk that investors may be focusing on. If yields continue to rise, then bond values may continue to fall.
But we'd rather focus on the positives. We see the increase in yields as an opportunity for investors who've been hesitant to invest in short- or intermediate-term bonds. The high yields offered today don't just mean a better opportunity for income-oriented investors—those high coupon payments could cushion potential price declines if yields were to rise modestly higher.
While upside may be limited with long-term bond yields, we still suggest a below-benchmark average duration, favoring short- and intermediate-term bonds over long-term bonds. Investors should always consider their own individual circumstances, investing time horizons, and risk tolerance when considering what maturities may be appropriate, however.
We're getting closer to a point where tactically adding some longer-duration bonds might become more attractive. If the upside risks to long-term yields come to fruition, and yields do move a bit higher, the risk/reward proposition could become more attractive. The economic outlook also matters—if we expect economic growth to slow considerably, we'll likely change our view and favor longer-term bonds.
A focus on short- and intermediate-term bonds doesn't mean hiding in cash because there's an opportunity cost to that approach. Two- and three-year Treasury yields are currently above yields on many shorter-term Treasury bills, suggesting investors may be able to earn more income by extending modestly beyond cash-like investments. If inflation pressures don't subside and the Fed ends up hiking more than expected, there could be potential price declines with the short- and intermediate-term bonds we prefer. Despite that, we think investors should focus on the higher yields that they currently offer rather than waiting for the Fed to keep hiking rates.
About the author