
Asset Management
Technical Analysis Weekly

- Market
- Support
- Resistance
- Technical View
-
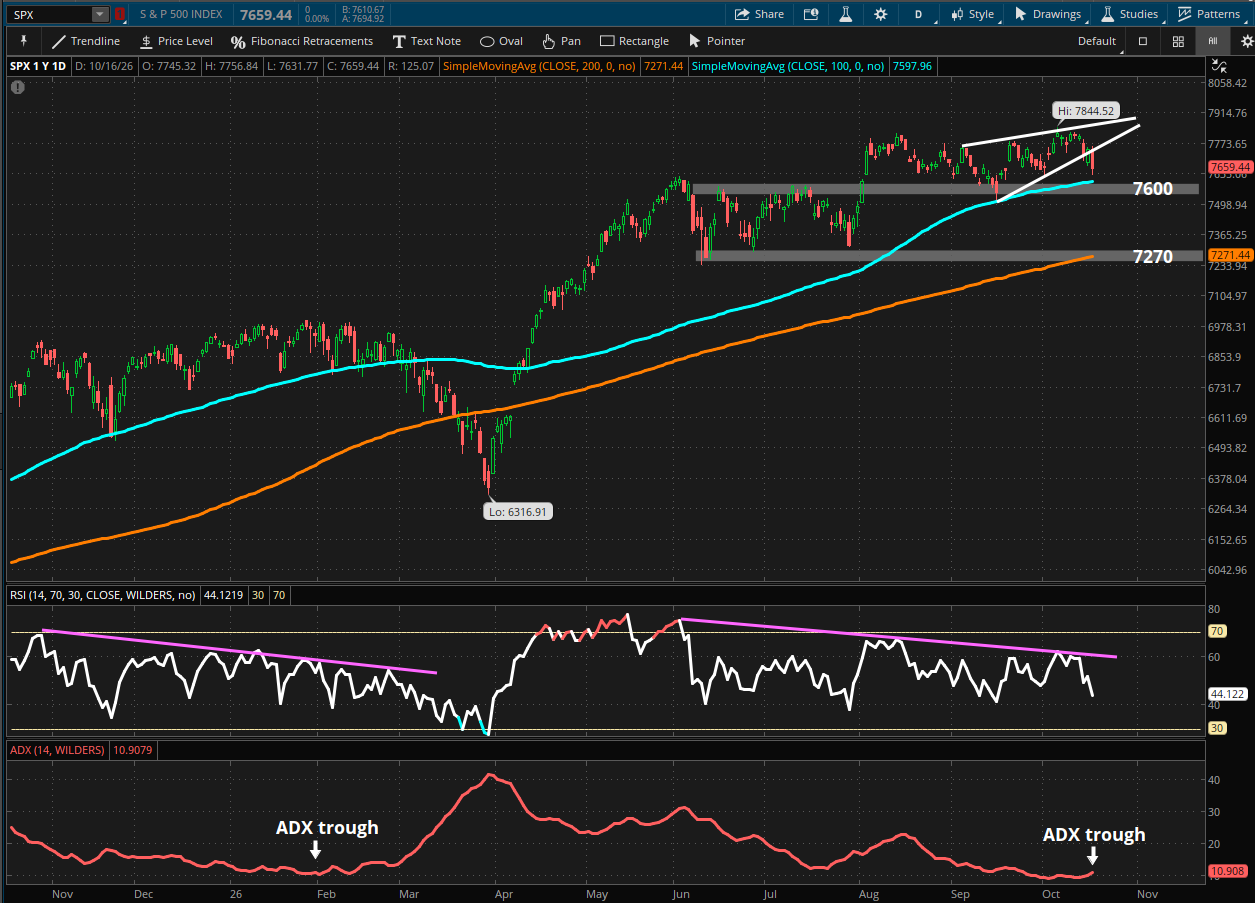
MarketS&P 500SupportFormer highs + 100-Day Simple Moving Average (DMA) ~7,600Resistance~7,780Technical ViewNeutral
-
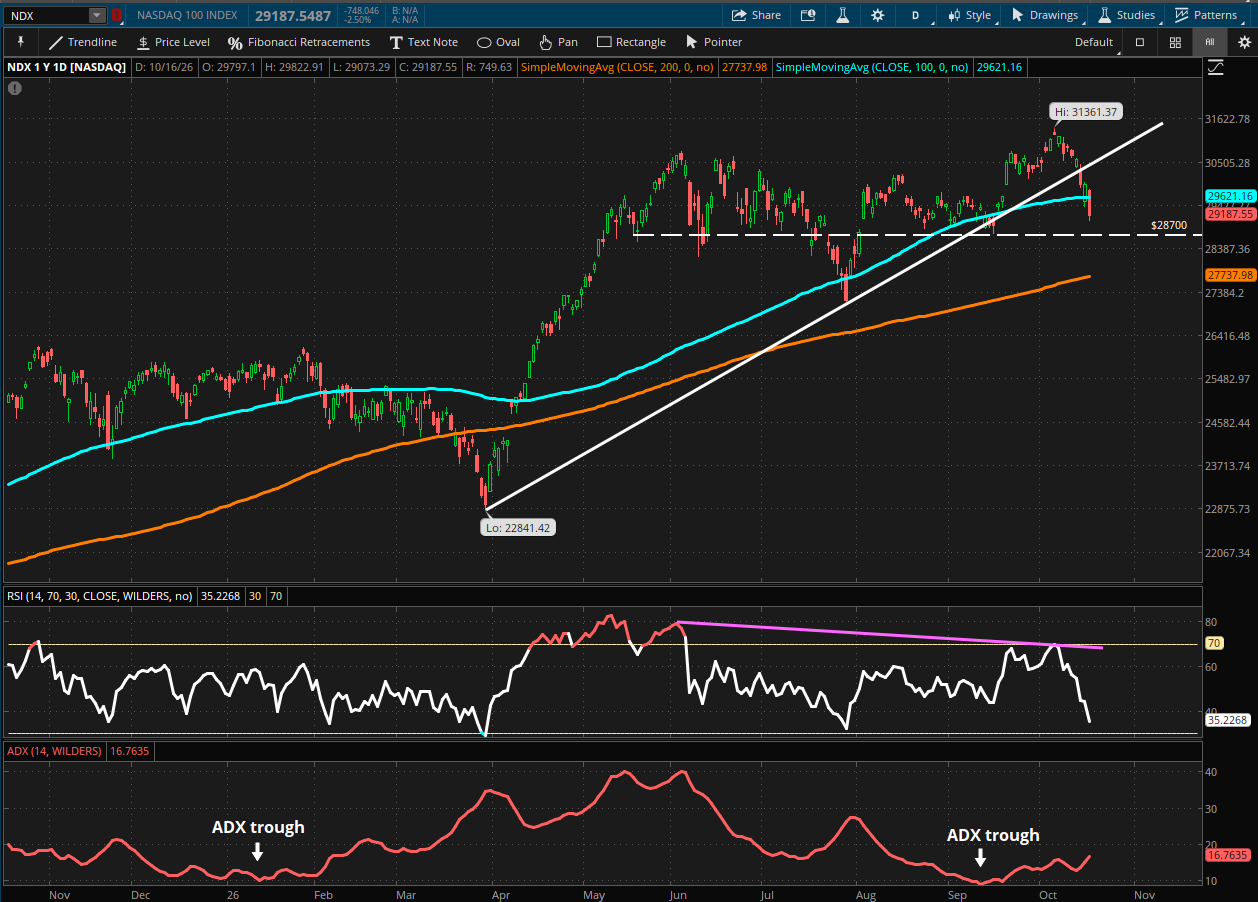
MarketNasdaq-100SupportFormer consolidation lows ~28,700Resistance100 DMA ~29,620Technical ViewNeutral/Bearish
-
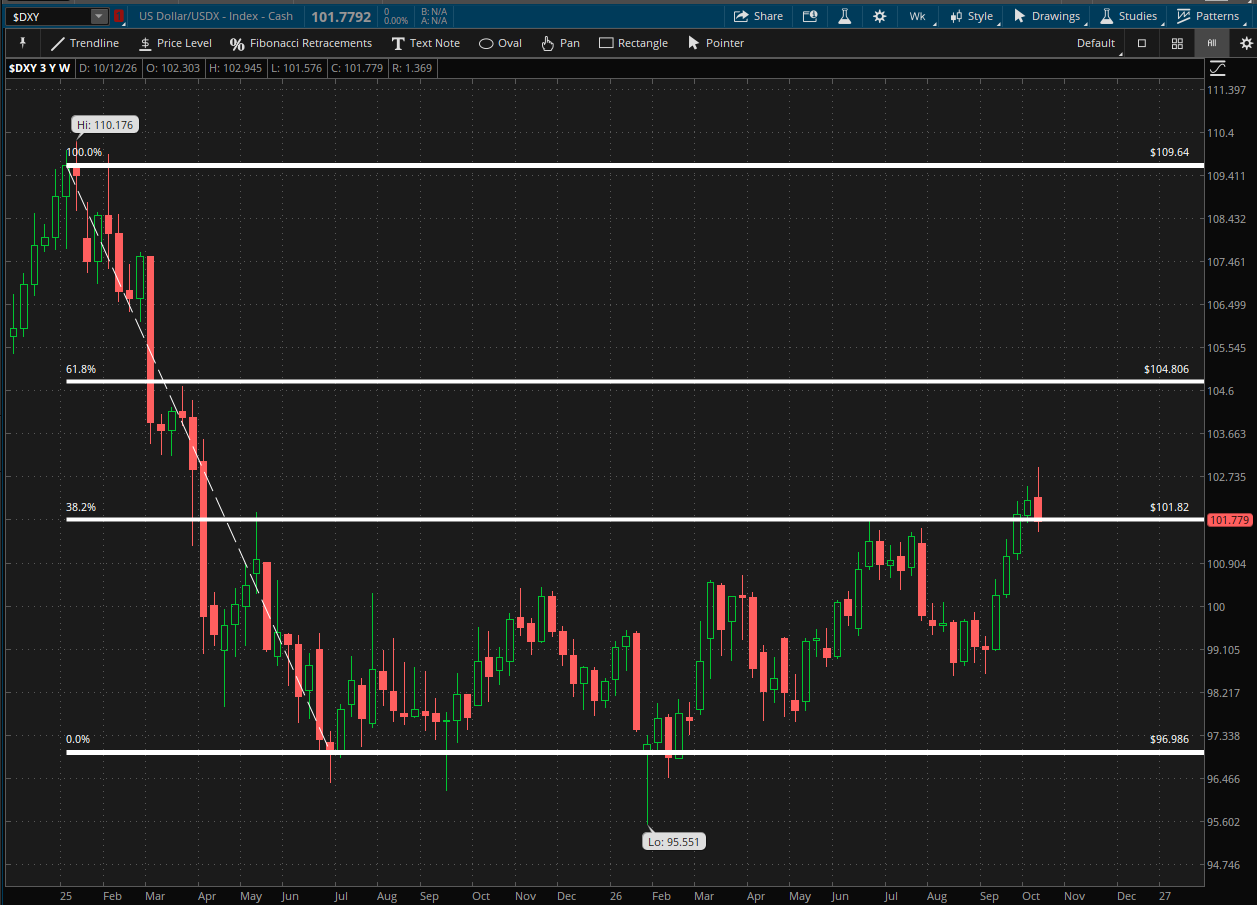
MarketU.S. DollarSupportFormer consolidation lows ~28,700
38.2% Fibonacci ~101.80
Resistance61.8% Fibonacci ~104.80Technical ViewNeutral-
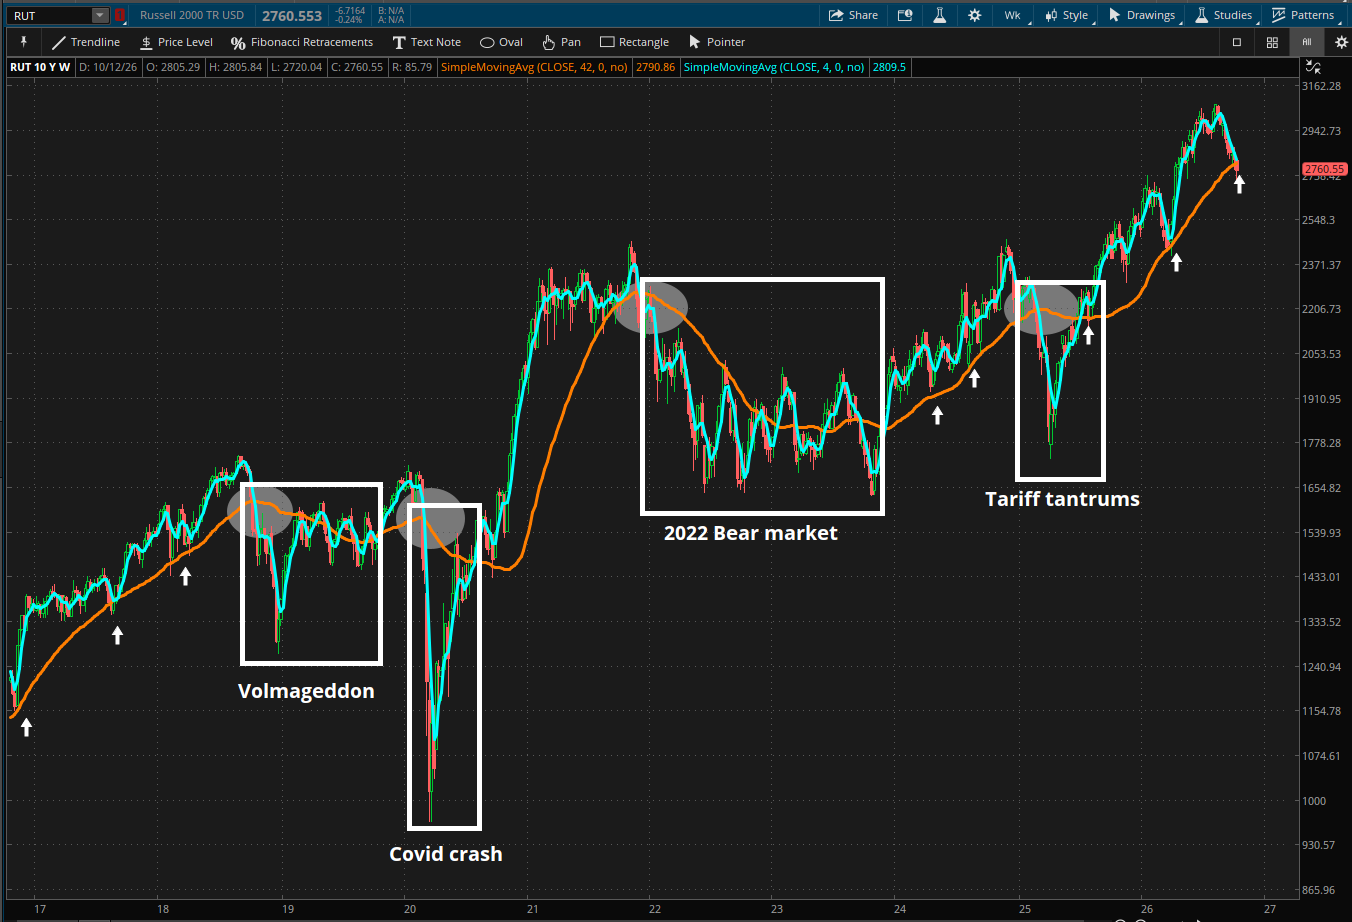
MarketRussell 2000SupportApril gap ~2,550Resistance200 DMA ~2,800Technical ViewBearish
-
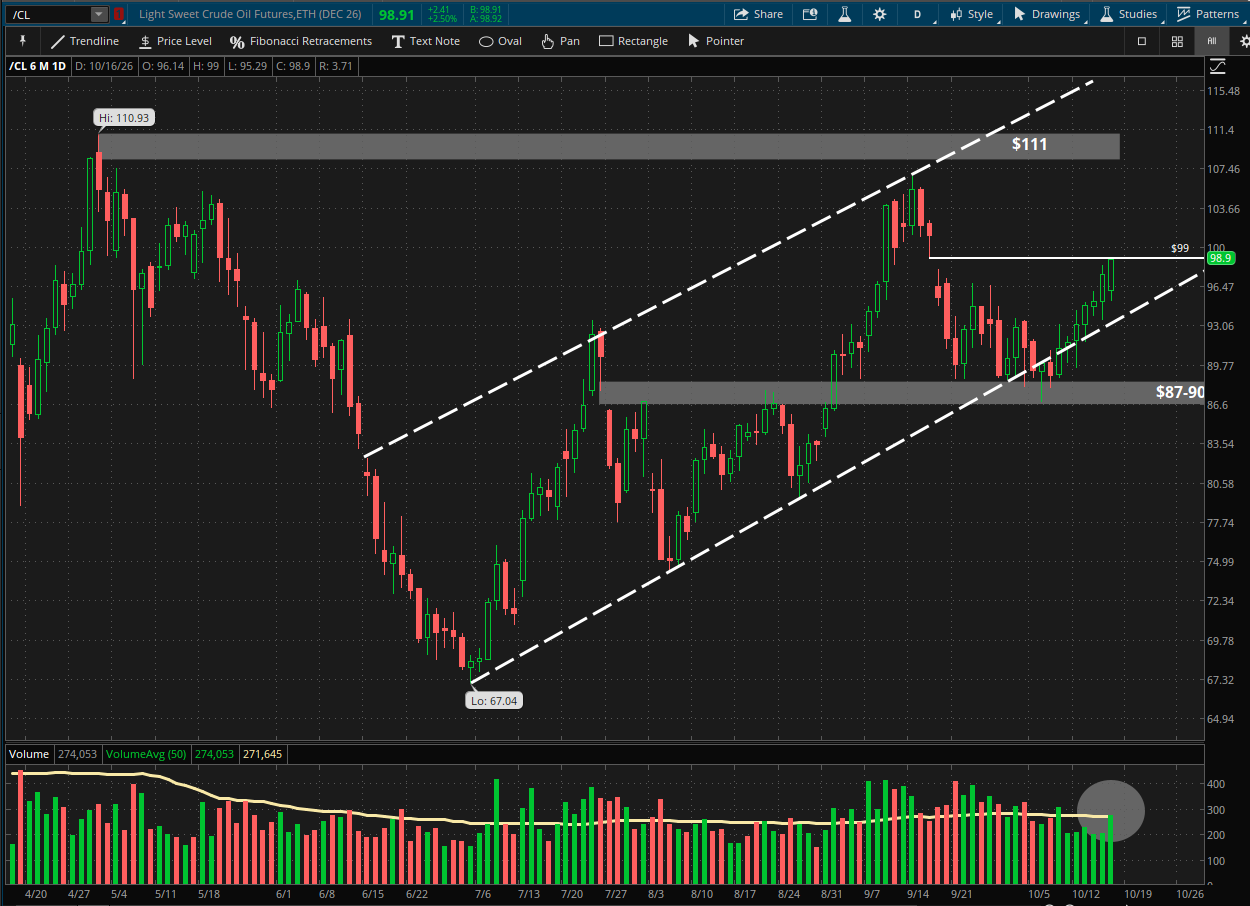
MarketCrude OilSupport50 DMA + rising channel support ~$90Resistance9/18 gap ~$99Technical ViewNeutral
-
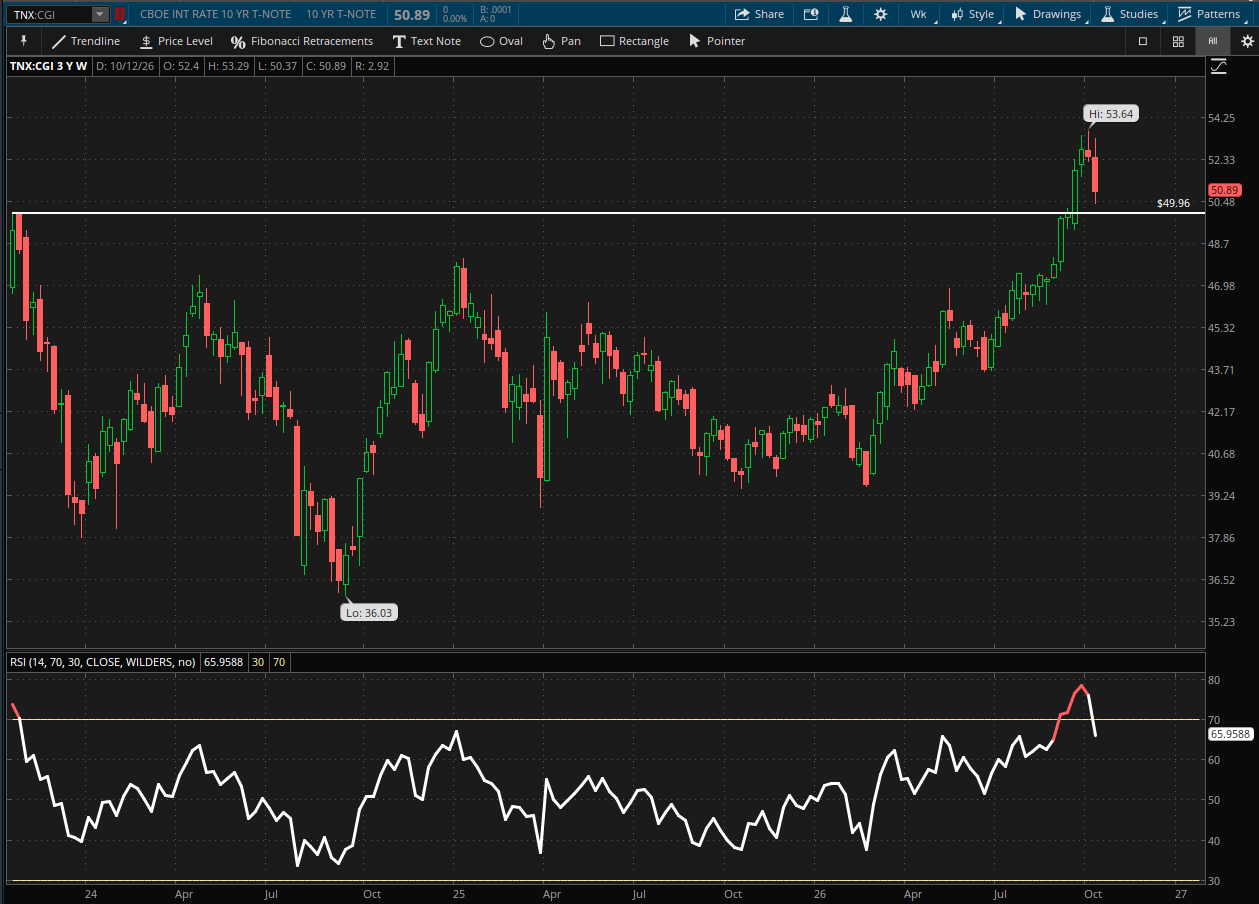
Market10-Year Treasury YieldsSupport2023 highs + 50 DMA ~5%ResistanceYearly highs ~5.37%Technical ViewNeutral
-
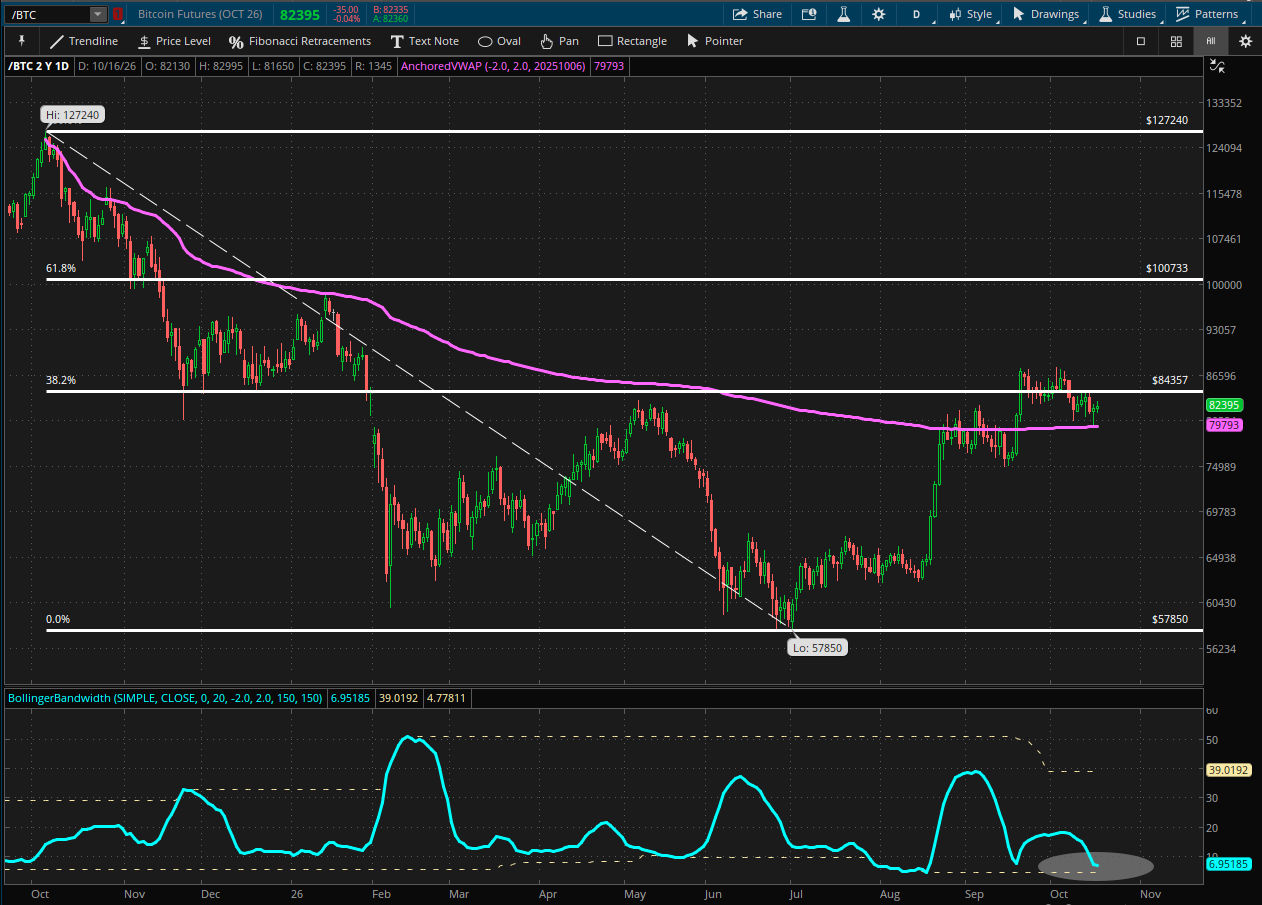
MarketBitcoinSupportAnchored Volume-Weighted Average Price (AVWAP) from all-time highs ~79,800Resistance38.2% Fibonacci ~84,360Technical ViewNeutral/Bullish
-
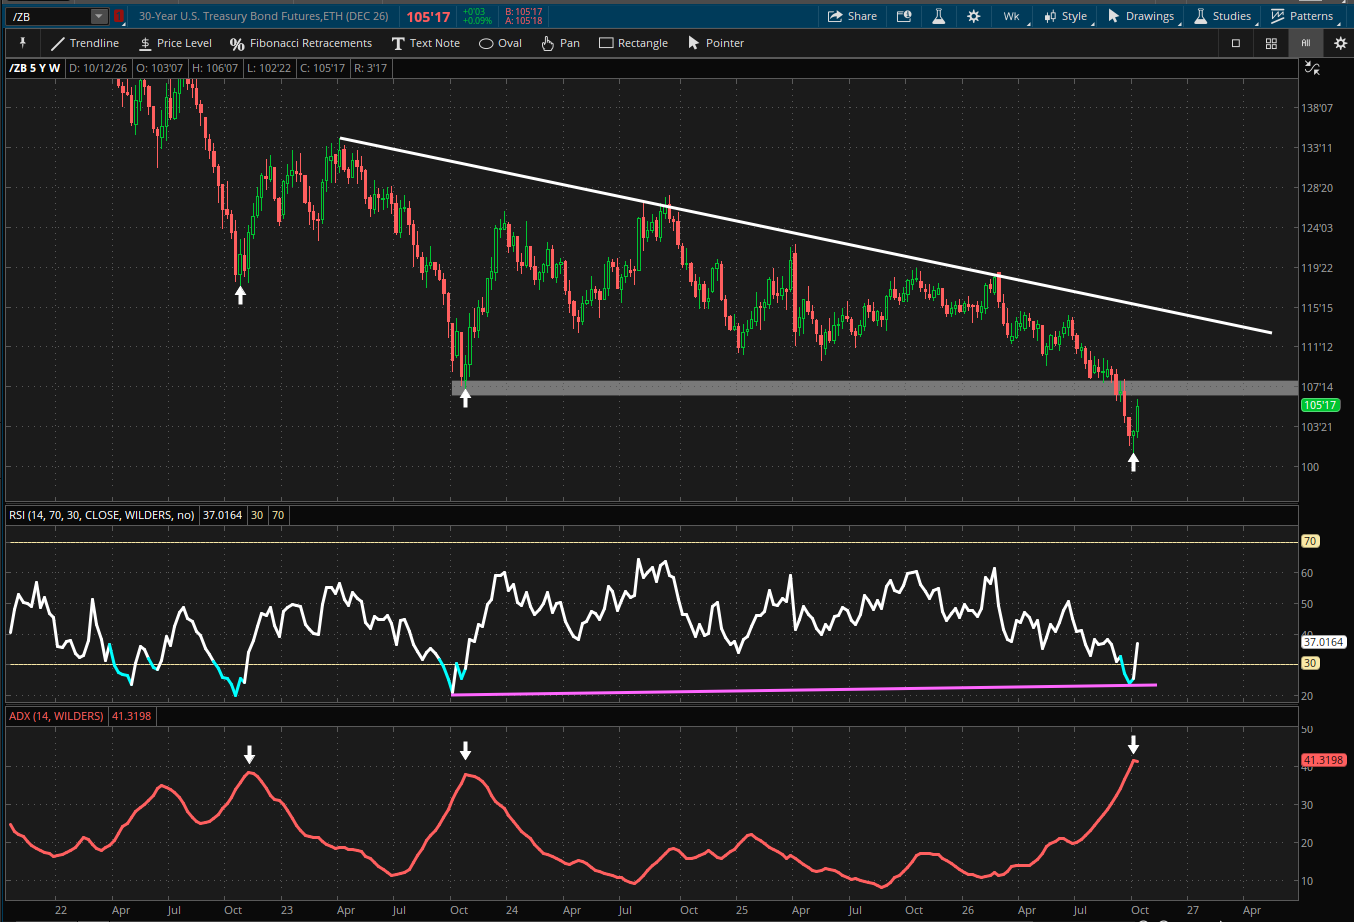
Market30-Year Treasury BondsSupport2022 lows ~97Resistance2023 lows ~107Technical ViewNeutral/Bullish
What are the markets doing this week?
While the individual charts tell different stories, several intermarket relationships appear to be converging around potentially important technical levels.
On the equity side, both the S&P 500 Index and Nasdaq-100 broke measures of short- and intermediate-term support after months of weakening momentum and deterioration in several risk-appetite measures, including Technology relative to the broader market and high-beta stocks relative to low-volatility stocks. At the same time, small caps appear to be attempting to hold near their long-term moving average support while displaying signs of oversold conditions.
Outside of equities, the U.S. Dollar appear to be above a major breakout level, while Treasury yields appear to be testing longer-term support near prior highs, and crude oil is approaching a notable resistance area following a rally on below-average volume. Bitcoin continues to coil between support and resistance as volatility compresses near yearly lows. Meanwhile, long-term Treasury bonds remain in a downtrend, although improving momentum, elevated trend-strength readings, and contrarian sentiment indicators may be suggesting that downside momentum is becoming less one-sided.
Taken together, these markets may be reflecting increasing uncertainty rather than a clear directional message. Momentum indicators in several markets appear to be moderating, while trend-strength and volatility measures suggest that larger moves may be developing beneath the surface. From a technical perspective, the coming weeks may help determine whether recent support levels can hold and whether risk appetite begins to stabilize or continues to deteriorate.
Technical takeaway #1: S&P 500 breaks trendline support of rising wedge
Source: ThinkorSwim trading platform.
See our full list of technical analysis terms. Past performance is no guarantee of future results.
The S&P 500 appears to have broken trendline support of a rising wedge formation on Friday following nearly four months of bearish momentum divergence as measured by the Relative Strength Index (RSI). A similar divergence was present late last year and early this year ahead of the February/March correction, although past performance is no guarantee of future results.
This recent price action followed failed breakouts in Technology relative to the S&P 500 and high-beta stocks relative to low-volatility stocks, relationships some technicians use to assess risk appetite. With momentum appearing to weaken within several of the S&P 500's largest-weighted groups, improved breadth and participation may be needed to prevent the index from reflecting some of the underlying deterioration that has occurred beneath the surface.
Looking at index price action, some technicians view breaks of trendline support as an early indication that a trend may be changing. If the S&P 500 fails to hold and rebound from current levels, technicians may monitor the confluence of former highs and the 100-day simple moving average (DMA) near 7600 as a potential support zone. Price is currently about less than 0.50% above this area. Another longer-term support zone may reside near the summer consolidation lows and the 200 DMA, sitting roughly 5% below current prices as of the time of this writing on Monday.
Finally, trend strength appears to have weakened, as the Average Directional Index (ADX) forms a trough. Some technicians monitor these periods because they can precede an expansion in price movement, although ADX does not indicate direction. With the S&P 500 breaking trendline support and several risk-appetite measures exhibiting signs of deterioration, traders may be watching closely for a potential increase in volatility and acceleration in a trend direction.
Technical takeaway #2: Nasdaq-100 breaks trendline and 100 DMA support
Source: ThinkorSwim trading platform.
See our full list of technical analysis terms. Past performance is no guarantee of future results.
Relative weakness in Technology is becoming increasingly evident in the Nasdaq-100. Recently, the index broke trendline support that had been tested multiple times over the past year. In technical analysis, the more points of contact price has with a trendline, the more significant that level becomes when it is broken. The move followed a multi-month momentum divergence as measured by the Relative Strength Index (RSI).
As of Friday's close, price appears to have broken a layer of intermediate support at the 100 DMA near 29,620, which may act as new near-term resistance. Following this break, technicians may monitor prior consolidation lows near 28,700 as the next potential support zone. That level sits less than 0.50% below current prices. From a longer-term perspective, another area of interest may reside near the July lows and the 200 DMA around 27,740. From a momentum perspective, the RSI is nearing oversold territory (an RSI reading below 30 is considered by technicians to signal a security may be oversold), similar to the levels reached during the July pullback. Technicians often monitor these types of momentum extremes for signs that downside momentum is becoming exhausted. However, in established downtrends, the RSI can remain oversold for extended periods, so oversold conditions alone are not necessarily indicative of an imminent reversal.
Unlike the S&P 500, the Average Directional Index (ADX), a measure of trend strength, has begun to turn higher from recent lows as the price trend has weakened. Some technicians interpret rising ADX readings following a trough as a sign of a developing trend. Technicians would perceive a move above 20 as a sign of a strong trend, although ADX does not indicate direction.
Technical takeaway #3: U.S. Dollar Index tests key support at 101.80
Source: ThinkorSwim trading platform.
See our full list of technical analysis terms. Past performance is no guarantee of future results.
The U.S. Dollar Index (DXY) was range-bound for more than a year before breaking out of a basing formation roughly two weeks ago. The breakout zone near 101.80 previously acted as resistance and coincided with the 38.2% Fibonacci retracement of the 2025 decline. Technicians often monitor former resistance levels to see if they act as potential support, and DXY closed on this area on Friday, forming a potential bearish engulfing candlestick pattern.
From a daily time frame perspective, RSI has retreated from overbought conditions (an RSI reading above 70 is considered by technicians to signal a security may be overbought), a development some technicians may interpret as a sign that upside momentum is beginning to moderate. Follow-through below last week's low near 101.57 could lead some market participants to monitor whether risk-sensitive assets begin to show relative strength to the US Dollar.
Technical takeaway #4: Russell 2000 near a long-term critical support zone at the 42-week simple moving average
Source: ThinkorSwim trading platform.
See our full list of technical analysis terms. Past performance is no guarantee of future results.
The Russell 2000 Index's 42-week simple moving average (SMA), which is roughly equivalent to the 200-day SMA, has often been monitored as a potential support level during stronger market environments, although past performance is no guarantee of future results.
Another technical development some technicians monitor is a "death cross," which occurs when the four-week SMA (roughly equivalent to the 20-day SMA) crosses below the 42-week SMA. Historically, this has sometimes occurred during periods of deteriorating trend conditions, although outcomes have varied.
Last week, the weekly candlestick tested both the four-week and 42-week SMAs. Technicians may be watching these levels closely in the coming weeks to assess whether support holds or whether the recent trend continues to weaken.
Technical takeaway #5: Low volume rally in crude oil as it tests $99 gap resistance
Source: ThinkorSwim trading platform.
See our full list of technical analysis terms. Past performance is no guarantee of future results.
After consolidating near rising channel trendline support over the past several weeks, Crude Oil rallied toward the September 18 gap near $99 before pausing on Friday. This area may be monitored as a potential resistance zone, particularly as the recent advance has occurred on declining and below-average volume until the gap closure on Friday. If price can scale above that potential near-term ceiling, technicians may look for another layer of potential resistance near the upper end of the rising channel near $111.
Energy stocks have continued to display relative strength versus the broader market. As several energy-related groups have reached new yearly highs, momentum as measured by RSI has confirmed those new highs, reaching overbought territory. Some technicians monitor these momentum extremes for signs of buyer exhaustion and potential mean reversion, although RSI can remain overbought for extended periods of time during persistent uptrends.
Technical takeaway #6: 10-year Treasury yields retest 3-year polarity near 5%
Source: ThinkorSwim trading platform.
See our full list of technical analysis terms. Past performance is no guarantee of future results.
This week, 10-Year Treasury yields pulled back after an extended advance. From a longer-term perspective, yields retested former three-year highs near 5%, an area some technicians may monitor as potential support. The pullback followed a move lower in RSI after reaching overbought territory.
Technicians may be watching to see whether yields retest former highs and potentially consolidate near current levels, as momentum appears to be moderating following the recent advance. Should yields stabilize or move lower, some market participants may monitor rate-sensitive areas of the market, including small caps, financials, utilities, and real estate, for signs of relative strength.
From an intermarket perspective, bond prices may also be worth monitoring, as Treasury yields and bond prices have historically exhibited an inverse relationship.
Technical takeaway #7: Bitcoin tests long-term support at its AVWAP from all-time highs
Source: ThinkorSwim trading platform.
See our full list of technical analysis terms. Past performance is no guarantee of future results.
The Anchored Volume-Weighted Average Price (AVWAP) estimates the average price paid, weighted by trading volume, since a particular event or date. Bitcoin has been holding its AVWAP from all-time highs, a level that has flipped from resistance into potential support near 79,800. Just overhead sits the 38.2% Fibonacci retracement near 84,360, a level technicians sometimes refer to as the "repair" ratio. A reclaim of that zone may add evidence that buyers are regaining control following the recent corrective phase.
Meanwhile, Bollinger Bands have contracted to some of the tightest levels seen all year as price coils between support and resistance. Some technicians monitor these volatility squeezes because they have occasionally preceded periods of increased price movement. Importantly, volatility expansions can develop in either direction.
Technical takeaway #8: 30-year Treasury bonds near resistance with a bullish backdrop
Source: ThinkorSwim trading platform.
See our full list of technical analysis terms. Past performance is no guarantee of future results.
Thirty-year Treasury bond futures recently broke below long-term support near 107, a level technicians may now monitor as a potential resistance zone. While the prevailing trend remains lower, several potentially constructive developments have emerged beneath the surface.
First, weekly RSI has formed a higher low while price has moved to a lower low, creating a potential bullish momentum divergence as the indicator has crossed above oversold levels, potentially setting the stage for mean reversion.
Second, the ADX has reached its highest level in more than three years. While ADX does not indicate direction, some technicians monitor historically elevated readings for signs that a prevailing trend may be becoming increasingly mature.
Finally, some technicians may point to last week's The Economist cover, titled "Will Bonds Blow Up?", as an example of the so-called "magazine cover indicator." This concept is rooted in contrarian sentiment analysis, which suggests that when a market narrative becomes prominent enough to appear on the cover of a major publication, the theme may already be widely recognized by investors and reflected in prevailing sentiment.
About the author
 Rachel DashiellHead of Technical Research and Strategy