
Asset Management
What Do Higher Yields Mean for Retirement Income?

Key takeaways
- Bond yields have risen sharply, improving the income available from many fixed income investments but creating near-term price pressure—particularly for bonds with longer durations.
- Retirees may benefit from matching duration to spending needs, diversifying across maturities and sectors, and keeping the core of a bond allocation focused on higher-quality holdings.
- Higher income can help support retirement spending, but investors should avoid building a portfolio around yield alone. A total-return approach may provide greater flexibility and diversification.
- Cash can play an important role in meeting near-term expenses, but holding too much may create reinvestment risk and a long-term return drag.
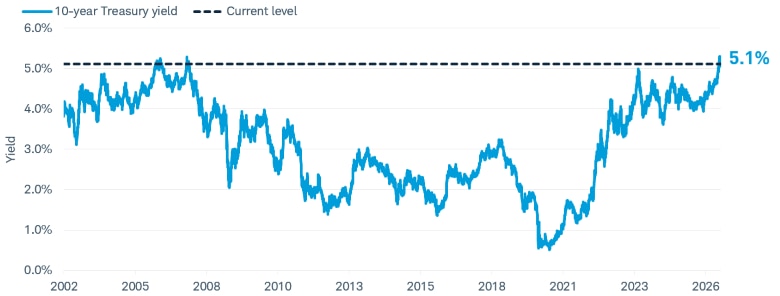
For much of the past decade, investors looking for portfolio income faced an uncomfortable choice: accept very low yields from higher-quality bonds or take more credit, interest-rate, or equity risk to generate additional income. That trade-off has changed. The 10-year Treasury yield recently moved above 5%, near its highest level in more than two decades, while yields across many other fixed income categories also moved higher.
10-year Treasury yield
Source: Bloomberg.
US Generic Govt 10YR (USGG10YR Index). Daily data from 12/31/2002 to 10/16/2026.
Past performance is no guarantee of future results.
Higher yields have pressured near-term returns
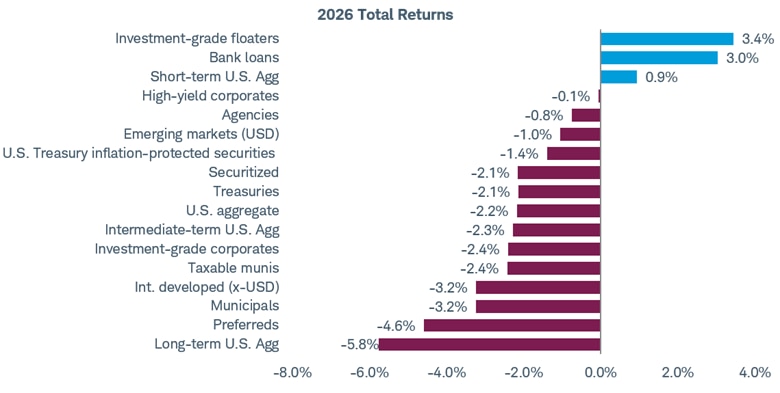
The increase in yields has not been painless. Bond prices generally fall when yields rise, and the recent increase in rates has created losses in parts of the fixed-income market. Longer-term bonds have generally been hit harder because their prices are more sensitive to changes in interest rates. For retirees who viewed bonds mainly as a stable source of income, the speed of the move may have been unsettling.
Year-to-date total returns
Source: Bloomberg.
Total returns from 12/31/2025 through 10/14/2026.
Total returns assume reinvestment of interest and capital gains.
Indexes representing the investment types are: Preferreds = ICE BofA Fixed Rate Preferred Securities Index; High-yield corporates = Bloomberg US High Yield Very Liquid (VLI) Index; Bank loans = Morningstar LSTA US Leveraged Loan 100 Index; Long-term U.S. Agg = Bloomberg US Aggregate 10+ Years Bond Index; Investment-grade floaters = Bloomberg US Floating Rate Notes Index; Investment-grade corporates = Bloomberg US Corporate Bond Index; U.S. aggregate = Bloomberg US Aggregate Index; Intermediate-term U.S. Agg = Bloomberg US Aggregate 5-7 Years Bond Index; Municipals = Bloomberg US Municipal Bond Index; Treasuries = Bloomberg US Treasury Index; Emerging markets (USD) = Bloomberg Emerging Markets USD Aggregate Bond Index; Securitized = Bloomberg US Securitized Bond Total Return Index; Agencies = Bloomberg US Agency Bond Total Return Index; U.S. Treasury inflation-protected securities = Bloomberg US Treasury Inflation-Protected Securities Index; Short-term U.S. Agg = Bloomberg US Aggregate 1-3 Years Bond Index; and Int. developed (x-USD) = Bloomberg Global Aggregate ex-USD Bond Index.
Indexes are unmanaged, do not incur fees or expenses, and cannot be invested in directly. Past performance is no guarantee of future results.
We suggest matching your duration to when you need the money
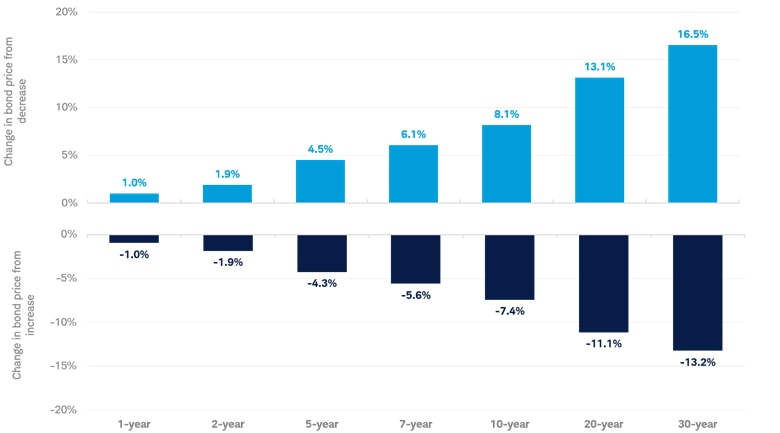
One way to manage this risk is to align duration with the timing of when you need the money. Money needed in the next year or two generally should not be exposed to the same degree of interest-rate risk as money earmarked for spending a decade from now. As illustrated in the chart below, bonds with longer maturities are more sensitive to changes in interest rates compared to bonds with shorter maturities. A bond ladder, which is an allocation of individual bonds with staggered maturity dates, can help create that alignment. As each rung matures, the proceeds can be spent or reinvested at yields at that time.
Interest rates can impact the prices of bonds (change in Treasury price based on 1% change in rates)
Source: Schwab Center for Financial Research and Federal Reserve, using yields as of October 16, 2026.
This chart assumes a "parallel" upward and downward shift in yields from current rates by 1%, meaning that rates would rise and fall 1% uniformly for Treasury bonds at each maturity. There is no single interest rate, and a rise in the short-term fed funds rate does not always result in a corresponding rise in longer-term Treasury rates. This hypothetical example is only for illustrative purposes. Investing involves risk, including loss of principal.
Past performance is no guarantee of future results.
Although the move in yields might be painful in the short term, it has tended to increase the attractiveness of fixed income for investors. Higher yields can increase the income that newly purchased bonds may generate and can improve the longer-term return outlook, but it also depends on other factors. For investors who are reinvesting interest or gradually building a bond allocation, today's higher starting yields may create opportunities that were difficult to find when rates were lower.
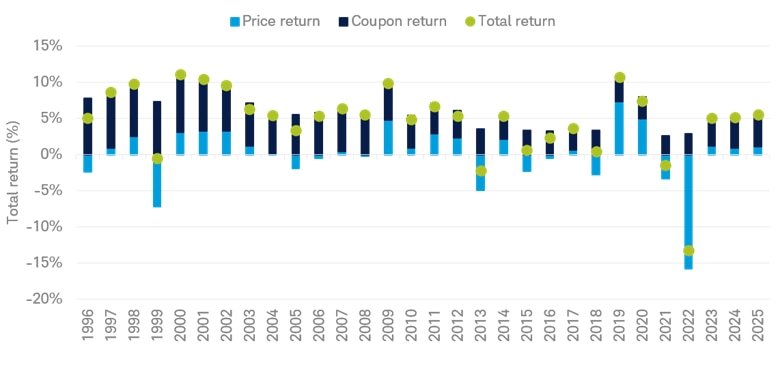
Investors should distinguish between short-term price performance and the longer-term role of income. Coupon income has historically been a major driver of bond total returns. When starting yields are higher, there tends to be more income available to absorb future price volatility. That does not guarantee a positive return over a shorter-term time horizon, but it generally can provide a larger buffer than investors had when yields were much lower.
Historically, coupon returns have made up the bulk of a bond's total return
Source: Annual return components for the Bloomberg US Aggregate Bond Index, from 12/31/1996 to 12/31/25.
Indexes are unmanaged, do not incur management fees, costs, and expenses and cannot be invested in directly.
Past performance is no guarantee of future results.
Income opportunities look more attractive today
We generally divide fixed income into two broad groups: core holdings and more aggressive holdings. Core fixed income typically includes Treasuries, Treasury Inflation-Protected Securities (TIPS), mortgage-backed securities, investment-grade corporate bonds, developed-market international bonds, and investment-grade municipal bonds. These investments can play different roles, but they are generally intended to provide income, diversification, and some degree of capital preservation.
More aggressive fixed income includes high-yield corporate bonds, emerging-market bonds, preferred securities, and bank loans. These categories may offer higher yields, but the additional income is compensation for additional risks. Depending on the investment, those risks can include lower credit quality, greater sensitivity to the economy or stock market, less liquidity, currency exposure, potential default, and more downside during periods of market stress.
Yields for a variety of fixed income indices
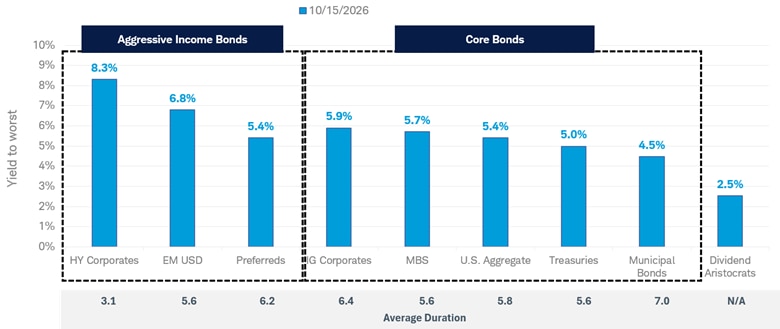
Source: Bloomberg, as of 10/15/2026.
Indexes represented are: Bloomberg US Aggregate Bond Index (U.S. Aggregate), Bloomberg US Corporate Bond Index (IG Corporates), Bloomberg US Corporate High-Yield Bond Index (HY Corporates), Bloomberg US Municipal Bond Index (Municipal Bonds), ICE BofA Fixed Rate Preferred Securities Index (Preferreds), Bloomberg Emerging Market USD Aggregate Index (EM USD Bonds), Bloomberg US MBS Index (MBS), Bloomberg US Treasury Index (Treasuries), and the S&P 500 Dividend Aristocrats Index (Dividend Aristocrats).
Yields shown are the average yield to worst except for the Dividend Aristocrats, which is the average dividend yield. Yield to worst is the lowest possible yield an investor can receive on a bond with a call option, barring default. Indexes are unmanaged, do not incur management fees, costs and expenses and cannot be invested in directly. Past performance is no guarantee of future results.
In the current environment, we're more favorable on investment-grade corporate bonds and municipals as part of the core allocation. For more aggressive income-oriented investors, we're more favorable toward preferred securities and high-yield corporate bonds.
Municipal bonds may be particularly compelling for investors in higher tax brackets because their interest is generally exempt from federal income taxes and may also be exempt from state income taxes when investors own bonds issued in their home states. The muni market has been especially hard hit by the rise in yields. Since June 30, 2026, the prices of existing munis have generally fallen more than those of other major fixed income investments, all else equal. The selloff has caused muni yields, relative to other highly rated alternatives, like Treasury bonds, to increase to levels we view as attractive.
For many retirees, the core of the fixed income allocation should remain in core holdings, with more aggressive sectors used sparingly. As a general framework, investors might consider limiting aggressive fixed income to roughly no more than 20% of the bond allocation, depending on their risk tolerance, time horizon, and need for liquidity. The appropriate amount can be lower, and in some instances, zero.
Don't build a retirement plan around yield alone
Higher bond yields can make an income-focused portfolio look more attractive, but retirement income is broader than interest and dividends. We see two general ways to turn a portfolio into spending: a total-return approach and an income-focused approach.
1. A total-return approach
A total-return strategy uses the portfolio's full return—interest, dividends, and price appreciation—to support withdrawals. Instead of requiring every holding to distribute cash, the investor maintains a diversified allocation and periodically sells investments or rebalances to fund spending.
The main advantage tends to be flexibility. Investors can choose from a broader set of investments rather than concentrating only in dividend- or interest-bearing securities. That can produce a more diversified and potentially more tax-efficient portfolio. It can also help the portfolio retain exposure to growth assets, which may be important during a retirement that lasts 20 or 30 years.
As an example of how this might work in practice, consider a $1,000,000 portfolio invested in 60% stocks, 35% bonds, and 5% cash. We would generally suggest a more diversified portfolio when investing, but this hypothetical allocation is useful for illustrating how a total-return strategy can deliver retirement income.
In this example, the portfolio needs to distribute $50,000, which is taken from the cash allocation at the start of the year. The table below shows the portfolio's hypothetical growth and how it could be rebalanced to its original allocation while also providing $50,000 in income.
How a rebalancing strategy could work to deliver retirement income
| Starting allocation | $ | % | Hypothetical growth rate | Ending allocation ($) | % | Rebalance move | Rebalance allocation ($) | (%) |
|---|---|---|---|---|---|---|---|---|
| Stocks | $600,000 | 60% | 8% | $648,000 | Sell $38,700 | $609,300 | 60% | |
| Bonds | $350,000 | 35% | 5% | $367,500 | Sell $12,075 | $355,425 | 35% | |
| Cash | $50,000 | 5% | Spent | $0 | 0% | Buy $50,775 | $50,775 | 5% |
| Total | $1,000,000 | $1,015,500 | $1,015,500 |
The trade-off is that a total-return strategy requires more maintenance, but we think this discipline and structure can be beneficial. However, a total return strategy doesn't insure against a loss. The investor needs a rebalancing process, a plan for which assets to sell, and enough near-term liquidity to avoid selling volatile assets at an unfavorable time.
2. An income-focused approach
An income-focused strategy attempts to meet spending needs primarily from bond interest, stock dividends, and other portfolio cash flows. It may feel more intuitive because the investor can spend the income without deliberately selling shares. For some retirees, that psychological comfort might make it easier to remain invested during volatility.
However, the distinction between "income" and "principal" can be misleading. A dividend or distribution reduces the value of the security or fund by a corresponding amount, all else equal.
More importantly, a narrow focus on yield can encourage investors to reach for yield and take on extra risk unknowingly. The highest-yielding securities often carry greater credit, liquidity, concentration, or price risk. Dividends might also be reduced, and high-distribution funds may return capital. For example, as shown below, investments that offer higher yields, like preferreds or high-yield corporate bonds, can have greater price drawdowns compared to more conservative fixed income investments, like municipal bonds or U.S. Treasuries. This matters because if a retiree has to sell a position at a time when prices are down, it can have long-term consequences.
Higher yields come with higher risks
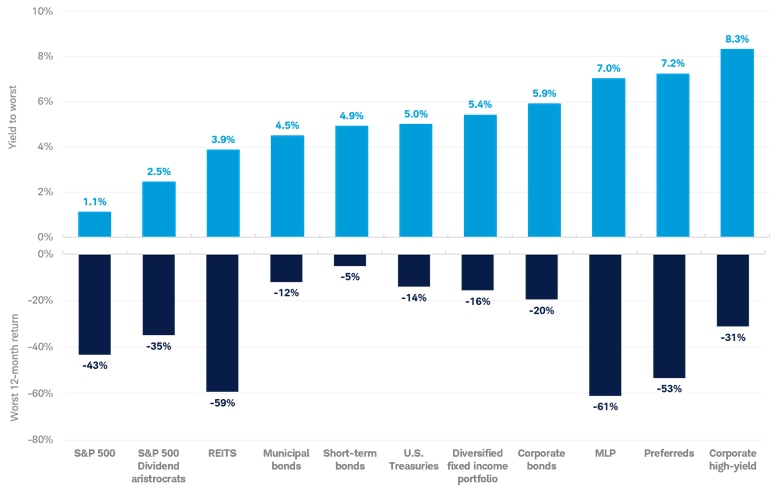
Source: Bloomberg.
Yields as of 10/15/26, and rolling returns using monthly data from 12/31/99 to 9/30/2026.
Indexes represented are: Bloomberg US Aggregate Bond Index (U.S. Aggregate), Bloomberg US Corporate Bond Index (IG Corporates), Bloomberg US Corporate High-Yield Bond Index (HY Corporates), Bloomberg U.S. Municipal Bond Index (Municipal Bonds), ICE BofA Fixed Rate Preferred Securities Index (Preferreds), Bloomberg Emerging Market USD Aggregate Index (EM USD Bonds), Alerian MLP Total Return Index (MLP), Bloomberg U.S. Treasury Index (Treasuries), and the S&P 500 Dividend Aristocrats Index (Dividend Aristocrats).
Yields shown are the average yield to worst except for the Dividend Aristocrats, which is the average dividend yield. Yield to worst is the lowest possible yield an investor can receive on a bond with a call option, barring default.
Indexes are unmanaged, do not incur management fees, costs and expenses and cannot be invested in directly. Past performance is no guarantee of future results.
One risk of focusing too heavily on income only is that an income-only portfolio may become concentrated in sectors that behave similarly. Preferred securities, high-yield bonds, dividend-paying stocks, real estate securities, and bank loans can all be sensitive to economic weakness or tightening financial conditions. Owning several of them does not necessarily create meaningful diversification. Higher-yielding investments tend to have higher correlations with one another.
The scatter plot below helps to illustrate this point. The y-, or vertical, axis is the correlation with aggressive income sectors; and the x-, or horizonal, axis is the correlation with U.S. large-cap stocks. Correlation is a statistical measure of how two investments have historically moved in relation to each other, and ranges from -1 to +1. A correlation of 1 indicates a perfect positive correlation, while a correlation of -1 indicates a perfect negative correlation. A correlation of zero means the assets are not correlated.
We've color coded core bonds in dark blue and aggressive income sectors in a lighter blue. Most of the light blue, or aggressive income sectors, are clustered in the upper right quadrant, meaning that they are highly correlated with one another and more correlated with equities than core bonds are. This matters because during periods of market stress, such a portfolio that's weighted heavily to aggressive income sectors may therefore provide less diversification than expected.
Correlation with U.S. large cap stocks vs. with aggressive income sectors
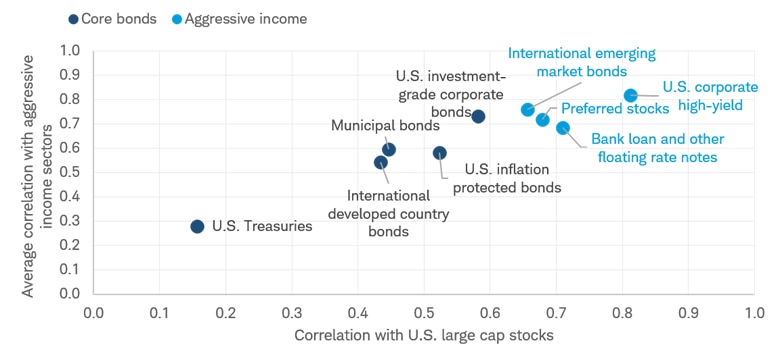
Source: Bloomberg, data from October 2016 to September 2026 using monthly data.
Bloomberg US High Yield Very Liquid Total Return Index (BVLNTRUU Index), Morningstar LSTA U.S. Leveraged Loan 100 Total Return Index (SPBDLL Index), ICE BofA Fixed Rate Preferred Total Return Index (P0P1 Index), Bloomberg EM USD Aggregate Total Return Index (EMUSTRUU Index), Bloomberg US Credit Total Return Index (LUCRTRUU Index), Bloomberg US TIPS Total Return Index (LBUTTRUU Index), Bloomberg Municipal Bond Index Total Return Index Value Unhedged USD (LMBITR Index), Bloomberg Global Aggregate ex-USD Total Return Index (Hedged) (LG38TRUH Index), Bloomberg US Treasury 3-7 Year Total Return Index (LT13TRUU Index).
Correlation is a statistical measure of how two investments have historically moved in relation to each other, and ranges from -1 to +1. A correlation of 1 indicates a perfect positive correlation, while a correlation of -1 indicates a perfect negative correlation. A correlation of zero means the assets are not correlated.
For illustrative purposes only.
For many retirees, a blended approach may be more practical. We believe it can make sense to use a combination of interest, dividends, and rebalancing proceeds to help deliver a retirement income paycheck. This approach can support a well-diversified portfolio without placing too much emphasis on an investment's yield.
Don't let attractive cash yields derail the long-term plan
Cash yields have risen along with short-term interest rates, making money market funds, Treasury bills, and other short-term investments more appealing. Cash can be useful for near-term spending, emergencies, and planned purchases. It may also help retirees avoid selling longer-term investments during a market decline.
But cash is not a complete retirement strategy. The yield on very short-term investments tends to move with Federal Reserve policy. If the Fed raises rates further, cash yields could rise. If inflation slows, growth could weaken, and if the Fed eventually cuts rates, those yields could fall quickly. Investors who wait in cash until the outlook feels certain may discover that bond yields have already declined and bond prices have risen before they reinvest. As can be seen in the chart below, the yield for very short-term investments, like three-month Treasury bills, closely tracks the fed funds rate. On the other hand, longer-term bonds, as represented by the 10-year Treasury yield, are influenced by the fed funds rate, but don't closely track it to the same degree as short-term investments do.
Short-term vs. long-term yields
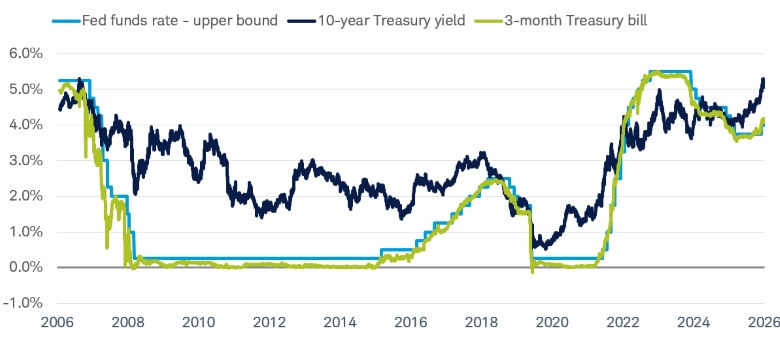
Source: Bloomberg, using daily data from 10/14/2006 to 10/14/2026.
US Generic Govt 10 Yr (USGG10YR Index), US Generic Govt 3 Mth (USGG3M Index), and Federal Funds Target Rate - Upper Bound (FDTR Index).
Indexes are unmanaged, do not incur management fees, costs, and expenses and cannot be invested in directly.
Past performance is no guarantee of future results.
One risk of staying too short-term is that you could potentially miss out on higher yields. This is reinvestment risk: The attractive yield available today may not be available when a short-term security matures. Longer-term bonds lock in a yield for a longer period and may appreciate if market rates fall, although they can decline if rates rise. Holding a mix of short- and longer-term investments can help reduce the need to time or guess the Fed's next move.
One practical approach is to separate the portfolio by time horizon. Near-term spending can be held in cash and short-term bonds. Intermediate spending can be matched with a ladder or intermediate-term bond allocation. Assets intended for later retirement years can remain invested for growth. This structure can make market volatility easier to tolerate because each dollar has a purpose.
What to consider now
Higher yields have improved the potential income available from fixed income. However, we do not believe that yield alone is a retirement income strategy.
We believe a well-constructed retirement income strategy should start with a plan for how much you can spend from your portfolio, identify appropriate investments, select a distribution strategy, and be reviewed and updated regularly.
The sharp rise in yields has created challenges, but it has also restored an important feature of bonds: meaningful income. Investors who build around their spending needs, rather than the latest rate forecast, may be in a more comfortable position to use that income for the role fixed income is meant to play.
About the author
