Asset Management
Schwab's 2026 Long-Term Capital Market Expectations

Markets are constantly evolving, and when it comes to investment planning, it's important to stay informed without being overly reactive. However, finding reliable long-term estimates, even for major asset classes, isn't always easy. That's where Schwab Asset Management's disciplined, data-driven approach comes in. We regularly update our Capital Market Expectations (CME) based on both quantitative analysis and qualitative insights from our senior investment professionals. These forecasts provide valuable perspective on how different asset classes—such as stocks and bonds—may perform over the next decade.
CMEs are nominal, meaning they include the impact of inflation; they are annualized, representing average yearly returns; and are calculated over a 10-year horizon, providing insight into potential market performance a decade into the future. All returns are expressed from a U.S. dollar perspective. Importantly, CMEs are based on representative benchmark indices rather than specific investment vehicles like exchange-traded funds (ETFs) or mutual funds. As a result, they don't account for costs such as fees or taxes.
Our 2026 outlook highlights the risks of elevated valuations and concentration in U.S. markets, the compelling diversification opportunities in international equities, and the continued potential in fixed income—where yields remain attractive despite recent interest rate reductions.
Persistent market imbalances—concentrated equity markets, high valuations, tight credit spreads, and a flatter-than-average yield curve—complicate the current investment landscape. While such imbalances can persist longer than expected, 2025 has demonstrated how quickly conditions can change. During the first half of the year, the "Magnificent 7" pulled back, international equities outperformed their U.S. counterparts, the dollar weakened, and the U.S. yield curve began to steepen. Though U.S. markets recovered in the second half, the fluctuations underscore the importance of maintaining a well-diversified portfolio.
Schwab's latest forecasts, based on data through October 31, 2025, cover the 2026–2035 period. By grounding decisions in these long-term expectations, investors can more confidently plan for the future.
How have our outlooks changed for 2026?
Our equity expectations are modestly lower this year, primarily because market prices outpaced increases in corporate earnings forecasts. We now expect U.S. large-cap equities to deliver annualized returns of 5.9% over the next decade, down slightly from last year's outlook of 6%.
Fixed income returns are also slightly lower. We expect U.S. aggregate bonds to deliver annual returns of 4.8% over the next decade, compared to 4.9% last year. Cash equivalent investments—such as Treasury bills—have seen a similar adjustment. As the Federal Reserve continues to reduce short-term rates, our 10-year forecast for cash now stands at 3.3%, down from 3.5% a year ago.
On the macroeconomic front, we've modestly lowered our 10-year forecast for real U.S. gross domestic product (GDP) growth to 1.9% from 2.0%, while our long-term U.S. inflation forecast has edged higher to 2.4% from 2.3%. This uptick reflects both near-term pressures—such as tariff uncertainty—and a longer-term trend that remains modestly above the Fed's 2% target.
Expected returns over the next 10 years
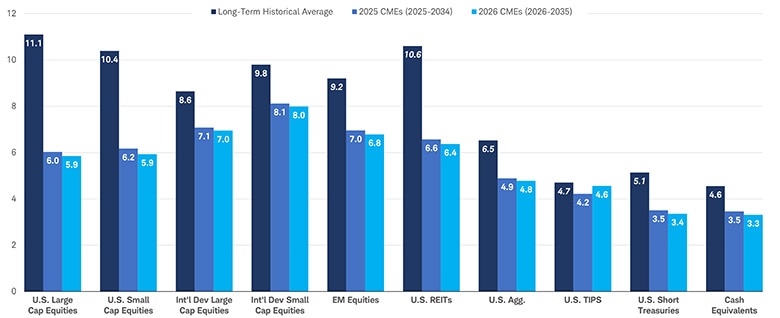
Source: Schwab Asset Management
Data: As of 10/31/2025.
Each bar represents an annualized 10-year nominal geometric return. The dark blue bar shows the long-term historical average, calculated using an annualized geometric average based on monthly total return data from January 30, 1970, onward (unless otherwise noted). The medium blue bar represents Schwab's long-term CME for 2025, and the light blue bar represents Schwab's long-term CME for 2026. Total return equals price growth plus dividend and interest income. Geometric returns account for the compounding nature of investment returns. This example does not reflect the effects of taxes or fees. Numbers are rounded to the nearest one-tenth of a percentage point. Forecasts contained herein are for illustrative purposes only, may be based upon proprietary research, and are developed through analysis of historical public data.
Benchmark Indices: S&P 500® Total Return Index (U.S. Large Cap Equities), Russell 2000® Total Return Index (U.S. Small Cap Equities), MSCI EAFE Net Return Index (Int'l Dev Large Cap Equities), MSCI EAFE Small Cap Net Return Index (Int'l Dev Small Cap Equities), MSCI Emerging Market Net Return Index (EM Equities), S&P U.S. REIT Total Return Index (U.S. REITs), Bloomberg U.S. Aggregate Bond Total Return Index (U.S. Agg.), Bloomberg U.S. TIPS Total Return Index (U.S. TIPS), Bloomberg U.S. Treasury 1-3 Year Total Return Index (U.S. Short Treasuries), and FTSE 3-Month U.S. Treasury Bill Index (Cash Equivalents).
Index Notes: CRSP 6-8 deciles was used for U.S. Small Cap Equities prior to 1979. MSCI EAFE Small Cap Index was used for Int'l Dev Small Cap Equities prior to 2001. MSCI Emerging Market Index was used for EM Equities prior to 2001. FTSE NAREIT All Equity REIT TR Index was used for U.S. REITs prior to July 1989. FTSE Treasury Benchmark 2 Year Index was used for U.S. Short Treasuries prior to 1992. Ibbotson 30-Day US Treasury Bill Index was used for Cash Equivalents prior to 1978. Historical returns for EM Equities start in 1988, U.S. REITs in 1972, U.S. Agg. in 1976, U.S. TIPS in April 1997, and U.S. Short Treasuries in 1980 due to data availability.
Navigating a complex economic environment
The Federal Reserve faces an increasingly complex balancing act at a time when traditional anchors of economic stability—stable growth, predictable inflation, and fiscal discipline—have loosened their hold. The central bank must now navigate the tension between the two sides of its dual mandate—stable prices and maximum employment—as inflation remains modestly above the Fed's 2% target and signs of a weakening labor market emerge. Meanwhile, the U.S. yield curve has steepened, which may reflect market concerns about persistent inflation and the government's ability to manage its mounting debt.
Risks remain present in the current environment. Geopolitical tensions, elevated U.S. debt levels, and policy uncertainty all add to the complexity of macroeconomic and asset class return forecasting. On the fiscal front, high federal spending could worsen deficit concerns, while aggressive spending cuts aimed at reducing deficits could slow growth. Escalating U.S.-China trade tensions could also create supply shocks that stoke inflation while dragging on growth. Meanwhile, weakening labor market conditions could signal shifting economic momentum.
Our 10-year forecast incorporates near-term influences—such as sticky inflation and the potential for more modest GDP growth—alongside longer-term structural trends.
Expected real GDP growth: A moderating pace ahead
We've modestly decreased our 10-year forecast for real U.S. GDP growth to 1.9%, down from 2.0% and well below the historical average of 2.7% since 1970. Several headwinds weigh on this outlook: elevated tariffs, if maintained, threaten higher business costs and reduced consumer purchasing power, while stricter immigration policies and an aging population may slow labor force growth. Since robust economic growth is essential for strong market returns, this slower pace influences our outlook.
Investment in artificial intelligence and related infrastructure may help offset some of these headwinds in developed markets. However, the productivity gains from emerging technologies are notoriously difficult to predict over the long term, creating additional uncertainty around future growth expectations.
Expected inflation: Above the Fed’s 2% target
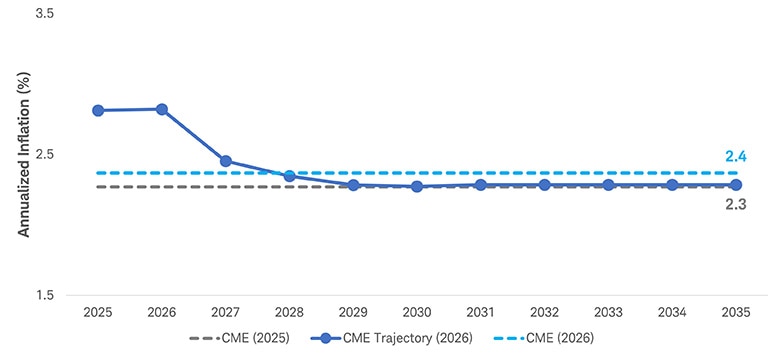
Source: Schwab Asset Management.
Data: Consensus Economics as of 10/31/2025.
The solid blue line with markers reflects the expected 10-year trajectory of inflation expectations as of October 31, 2025. The dashed blue line reflects the 10-year weighted average forecast for 2026, and the dashed gray line reflects the 10-year weighted average forecast for 2025. Forecasts contained herein are for illustrative purposes only, may be based upon proprietary research, and are developed through analysis of historical public data.
Inflation (as measured by the Consumer Price Index, or CPI) has eased since its pandemic-era peak but remains above central bank targets and continues to pose a risk for investors, particularly given mounting government debt and policy uncertainty. Our long-term inflation forecast has edged up to 2.4% from 2.3%, reflecting near-term pressures, such as tariff uncertainty, and a longer-term trend that remains modestly above the Fed's 2% target.
U.S. dollar: A gradual weakening ahead
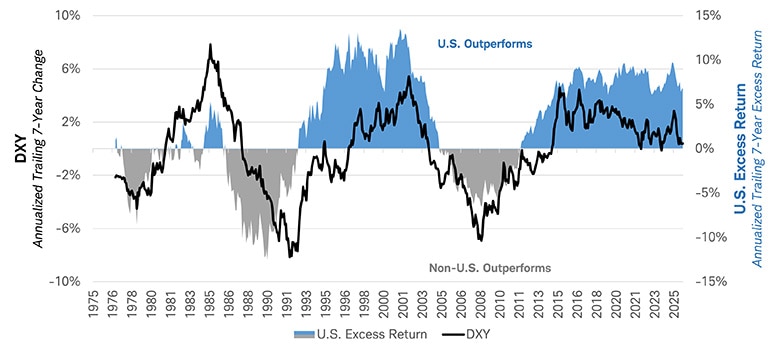
Source: Schwab Asset Management
Data: Bloomberg, Morningstar as of 10/31/2025.
The black line reflects the annualized trailing 7-year change in the DXY Index. The gray and blue shaded area reflects the annualized trailing 7-year excess return of the S&P 500 over the MSCI EAFE. For illustrative purposes only. Past performance is no guarantee of future results.
We anticipate a gradually weaker dollar over our forecast horizon. While our forecast has long been at odds with the dollar's persistent tendency to trade above "fair value"—in part due to its role as a global reserve currency—2025 demonstrated how quickly conditions can change. Driven by shifts in trade policy and increased international hedging of U.S. dollar asset exposure, the dollar experienced notable depreciation. At the same time, the price of gold surged as investors and central banks sought alternatives to dollar-based assets.
The dollar's strength since the global financial crisis has historically provided a tailwind to U.S. market performance, but further dollar weakness could shift this dynamic. For U.S. dollar-based investors, a weaker dollar could boost the appeal of international investing without currency hedging, as it may provide a tailwind to returns for non-dollar-based assets.
Equity market outlook: Valuations remain elevated
Even though U.S. markets struggled in the first half of 2025, the S&P 500® achieved another strong year, with a broad recovery driven largely by sustained enthusiasm around artificial intelligence. This raises the question: How much room is left for further growth?
Several factors complicate the outlook for equities. U.S. valuations remain elevated, and concentration in large-cap indices has reached record highs, with the largest 10 companies in the S&P 500—mostly in technology and growth sectors—representing approximately 40% of the index's market capitalization. This concentration raises questions about whether current prices reflect sustainable earnings growth or an emerging bubble. With less room for error, the current environment presents both significant opportunities and notable risks.
Key drivers of expected equity returns
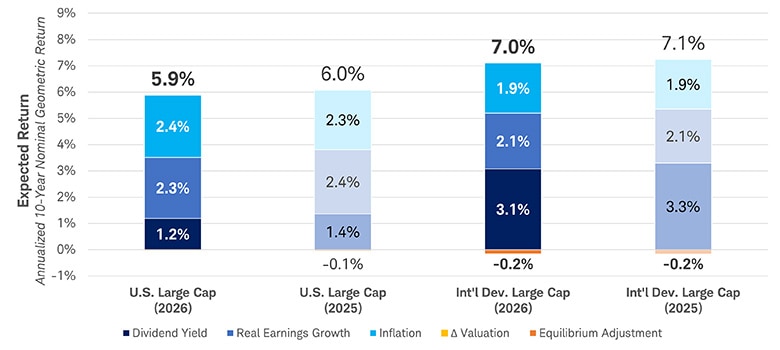
Source: Schwab Asset Management
Data: As of 10/31/2025
Each bar reflects Schwab's long-term geometric return expectation for a given asset class. The colors within each bar represent the return contributions from individual building blocks used to construct CMEs. The "equilibrium adjustment" reflects an adjustment of our proprietary views toward the market-derived equilibrium return using a modified Black-Litterman model. Change in valuation (P/E) is assumed to have a long-term average of 0%.
Benchmark Indices: S&P 500® Total Return Index (U.S. Large Cap), MSCI EAFE Net Return Index® (Int'l Dev Large Cap).
For illustrative purposes only. Past performance is no guarantee of future results.
Higher index prices create a challenging starting point for U.S. equity valuations, though improvements in the earnings growth outlook have helped offset some of that potential drag. Investors perceive AI-led productivity gains as a driver of earnings growth—potentially justifying some of the current premium—but lofty valuations come with equally lofty expectations. If earnings growth fails to deliver, future returns could fall short. On balance, we expect U.S. large-cap equities to deliver annualized returns of 5.9% over the next decade, down slightly from last year's outlook.
International equities: A compelling diversification opportunity
After years of underperformance, developed international equities performed well in 2025, outpacing their U.S. counterparts. Looking ahead, we forecast 7% annualized returns over the next decade compared to 5.9% for U.S. large-cap equities. This advantage stems largely from more attractive valuations, even as U.S. equities benefit from stronger earnings growth expectations. International equities also offer higher expected dividend yields and typically come with greater volatility—with the latter being a risk for which investors expect to be compensated.
Beyond the return potential, international equities present a compelling case for diversification. They offer exposure to different economies, sectors, regulatory environments, and consumer demographics—helping to manage risks associated with the highly concentrated U.S. market. For U.S. dollar-based investors, a weakening dollar could provide an additional tailwind to international returns, while foreign currency exposure can enhance diversification during periods of U.S.-driven market volatility.
Fixed income outlook: Yields remain attractive
Even as the Federal Reserve continues to lower short-term interest rates, our 2026 outlook highlights ongoing opportunities in fixed income. Yields remain attractive, though slightly lower than last year.
Short-term rates closely follow the federal funds rate, making them sensitive to policy changes, while longer-term rates are driven more by growth and inflation expectations. These dynamics shape our U.S. fixed income outlook, which has improved meaningfully compared to the past decade, driven primarily by higher starting yields.
With yields elevated across the curve, we project U.S. government bonds will continue to deliver some of their strongest long-term returns since the financial crisis—a welcome development for investors seeking income and diversification. We expect U.S. aggregate bonds to deliver annual returns of 4.8% over the next decade, down slightly from last year's forecast of 4.9%1. While this outlook marks an improvement from the past decade, returns are still expected to fall below long-term historical averages. Interest rates are expected to remain elevated relative to recent history, but a return to the 1980s highs that supported even higher total returns is unlikely.
We have also lowered our forecasts for cash equivalent investments due to declining starting rates. As the Fed continues to reduce rates, our 10-year forecast for cash equivalent returns now stands at 3.3%, down from 3.5% a year ago. This outlook reflects rate estimates that, while higher than the extreme lows of the past decade, are below current levels.
U.S. Treasury yield curve
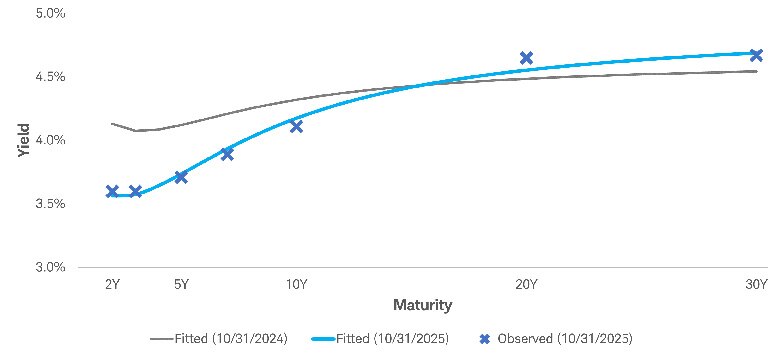
Source: Schwab Asset Management
Data: FRED as of 10/31/2025
The blue markers reflect the observed yield curve as of October 31, 2025. The blue line reflects the fitted Treasury curve as of October 31, 2025. The gray line reflects the fitted Treasury curve as of October 31, 2024. For illustrative purposes only. Past performance is no guarantee of future results.
The U.S. yield curve has steepened over the past year, with short-term yields declining and long-term yields rising slightly. However, it remains relatively flat compared to historical norms, and credit spreads remain tight. These factors continue to temper our fixed income expectations and underscore the complexity investors face in the current environment.
Investors seeking higher yields may need to extend duration compared to last year, but this comes with a cost: greater exposure to interest rate risk.
Expected term premium and real yield
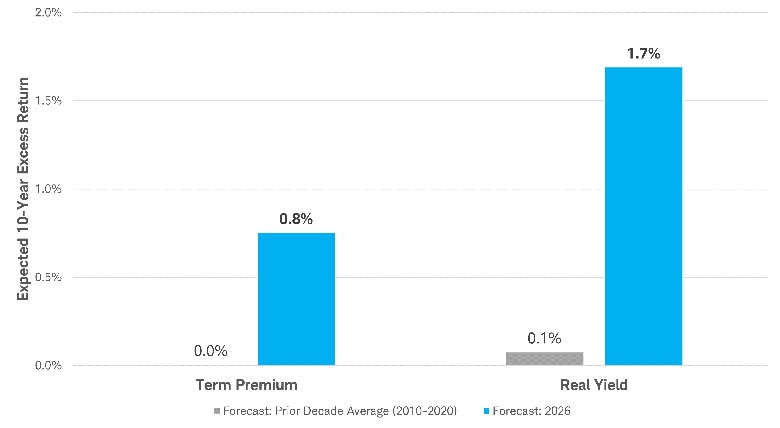
Source: Schwab Asset Management
Data: FRED as of 10/31/2025
Term premium: Expected 10-year excess returns are calculated as the U.S. Treasury 10-year yield minus Schwab’s cash CME. Real yield: Expected 10-year excess returns are calculated as the U.S. Treasury 10-year yield minus Schwab’s inflation CME. The gray bar represents the average of Schwab's 10-year forecasts from 2010–2020. The blue bar represents Schwab's current 10-year forecast as of October 31, 2025. For illustrative purposes only. Past performance is no guarantee of future results.
Note: Term premiums are the extra yield investors demand to compensate for the risk of holding long-term bonds versus a series of short-term bonds. Real yields are nominal yields adjusted for inflation.
Positive expected term premiums and positive expected real yields have made bonds more appealing than they've been in some time, giving fixed income a more meaningful role in portfolios.
Compared to the prior decade, investors now demand more compensation for holding long-term bonds, reflecting concerns about persistent government deficits and inflation. We expect this positive term premium to persist, making long-duration bonds more attractive from a return perspective. It's also useful to focus on real yields when navigating the bond market. Both cash and fixed income returns are expected to outpace inflation, delivering positive real returns.
We expect cash yields to gradually decline, making it advantageous to lock in longer-term rates now to provide stability and help minimize reinvestment risk. However, this improved return outlook comes with important caveats. While investors are better rewarded for holding longer-term bonds, their traditional hedging role works best for certain risks. Bonds can provide dependable income during economic slowdowns, but in periods of rising inflation—like during the pandemic—they may not offer the diversification benefits investors expect. So far, concerns about the long-term sustainability of U.S. debt levels and tariff actions appear to be manifesting through higher term premiums and a weaker dollar rather than a sharp sell-off of Treasuries, though this risk remains.
Expected equity risk premium over time
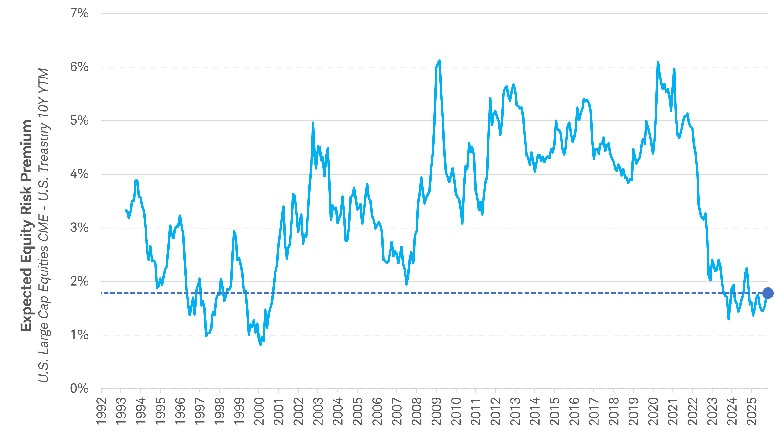
Source: Schwab Asset Management
Data: Bloomberg as of 10/31/2025
The expected equity risk premium measures the extra return stocks are expected to deliver over Treasury securities as compensation for higher risk. Total return equals price growth plus dividend and interest income. This example does not reflect the effects of taxes or fees. For illustrative purposes only. Past performance is no guarantee of future results.
Benchmark Indices: S&P 500® Total Return Index (U.S. large-cap equities), U.S. 10-Year Treasury constant-maturity yield.
Index Notes: The U.S. 10-Year Treasury constant-maturity yield is an index based on the average yield of a range of Treasury securities, all adjusted to the equivalent of a 10-year maturity. Yields on Treasury securities at constant maturity are determined by the U.S. Treasury from the daily yield curve.
When comparing stocks and bonds, it's helpful to consider the equity risk premium (ERP)—the extra return stocks are expected to deliver over "risk-free" investments like Treasury securities as compensation for higher risk. While forecasting the exact level of the equity risk premium is challenging, comparing it to historical norms and tracking its direction remains informative.
The expected ERP has shifted modestly since last year but remains historically low due to elevated valuations and higher bond yields. It has declined to around 2%, well below the highs seen after the global financial crisis. While stocks are still expected to outperform bonds, the gap between their expected returns remains narrow.
The importance of thoughtful diversification
The combination of risks and market imbalances investors face today reinforces the importance of strategic asset allocation and diversification. Maintaining focus on long-term financial goals rather than reacting to short-term market noise becomes especially important.
Diversification is more than simply spreading investments across asset classes—it's about building a portfolio that includes assets that respond differently to market conditions. The traditional stock-bond approach relies on a low or negative correlation between stocks and bonds to reduce volatility, but when stocks and bonds move together—as they did in 2022—these diversification benefits diminish. That said, bonds still play an important role in portfolios. High-quality fixed income maintains the lowest correlation to equities among widely traded, public asset classes, and the return to a higher-yielding environment has restored its capacity to deliver significant positive returns if rates fall.
Bonds can provide dependable income during economic slowdowns, though they show limitations during periods of rising inflation or fiscal stress. To address these inflation-related limitations, consider adding inflation-resilient assets such as Treasury Inflation-Protected Securities (TIPS) and real estate investment trusts (REITs). TIPS can provide reliable protection if inflation picks up unexpectedly. REITs provide exposure to real assets—tangible physical properties like office buildings and data centers—while maintaining the liquidity and accessibility of publicly traded securities. They offer both income-generating stability and participation in economic growth, with rising rents and property values providing a reasonable inflation hedge.
While diversification across asset classes and geographies cannot guarantee outperformance in every period, it remains the most reliable tool for managing risk and preserving capital in an uncertain market environment.
What can investors do now?
The power of compound returns—the cumulative effect of gains or losses over time—means that even small differences in portfolio returns can have a substantial impact over the long term. With that in mind, here are a few key considerations:
- Establish realistic financial goals: Develop a financial plan tailored to your personal goals and be ready to adapt as life circumstances change. Schwab's CMEs can help you create a plan with more realistic expectations.
- Maintain savings discipline: While returns can fluctuate from year to year, resist the urge to reduce your savings in response to market volatility. Expected returns are not guaranteed, and the more you save, the greater the cushion you'll have if actual returns fall short of expectations.
- Build a diversified portfolio: Construct a portfolio aligned with your goals, time horizon, and risk tolerance, using a mix of asset classes that perform differently under various market conditions. Since predicting the best-performing asset class each year is challenging, diversification helps mitigate the impact of market volatility and reduces the risk of chasing past performance.
Schwab's CMEs are designed to guide realistic long-term planning, not to time the market. If you don't have a financial plan, now is a great time to create one. If you already have one, consider reviewing it with Schwab's CMEs in mind.
1 These figures don't reflect investment fees, taxes, or tracking differences, so it's important to account for these real-world costs when applying these expectations to your personal situation. Tax treatment can significantly impact net returns, particularly for fixed income held in taxable accounts, where interest income is typically taxed at ordinary income rates.
About the authors

Emre Erdogan
