Schwab Target Funds
Summary
The Schwab Target Funds are all-in-one diversified mutual funds, managed according to a projected retirement date. Portfolio managers rebalance the funds to make them more conservative over time.
Objective
The funds seek to provide capital appreciation and income consistent with their current asset allocation.
Highlights
- Reallocated annually to become more conservative over time to help meet investors’ retirement goals
- Competitively priced so your investment goes further
- Combines active and passive proprietary and sub-advised / externally managed strategies*
What is a target date fund?
A target date fund seeks to provide a convenient, all-in-one portfolio solution with a diverse asset mix across equity, fixed income, and cash equivalents allocations that progressively becomes more conservative as the target date—usually retirement—approaches.
Glide path
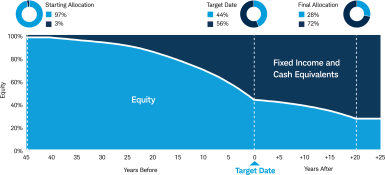
The target date is the date when investors are expected to begin gradual withdrawal of fund assets. With the goal of becoming more conservative over time, each fund is reallocated annually to reduce equity and increase fixed income and cash equivalents allocations. The starting allocation of 97% equity and 3% fixed income and cash equivalents changes over time until it reaches 44% equity and 56% fixed income and cash equivalents at the target retirement date. At this time, each fund will continue to reduce its allocation to equity investments for an additional 20 years, reaching its most conservative policy allocation of 28% equity and 72% fixed income and cash equivalents. At this point, the allocation is intended to remain static. At the target retirement date, it is assumed that investors will no longer contribute assets to the fund and, dependent upon each individual’s financial circumstances, will begin to gradually withdraw assets invested in the fund over time.
Selecting a fund
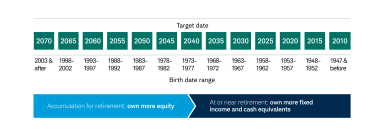
In addition to age and anticipated retirement date, investors should consider their risk tolerance, personal circumstances and complete financial situation and any other investment options prior to investing in a particular target date fund.
Consider investing in the fund closest to your target retirement date, and ensure that the asset allocation matches your risk tolerance, personal circumstances, and complete financial situation. It’s always important to remain aware of your allocation and check in regularly so that you can make updates as your circumstances change.
Underlying Fund Managers or Sub-Advisors
- Allspring Funds Management, LLC
- American Century Investment Management, Inc.
- Baillie Gifford Overseas Limited
- Baird Advisors
- Columbia Management Investment Advisers, LLC
- Dodge & Cox
- Driehaus Capital Management, LLC
- Goldman Sachs Asset Management, L.P.
- Harris Associates L.P.
- JP Morgan Investment Management Inc.
- Loomis, Sayles & Company, L.P.
- Pacific Investment Management Company, LLC
- PGIM Investments, LLC / Jennison Associates, LLC
- Schwab Asset Management
The Schwab Target Funds invest in certain Schwab Funds to gain exposure to underlying third-party sub-advised strategies.
Schwab Asset Management is pleased to announce enhancements to the Schwab Target Date Solutions, effective February 1, 2026. These include changes to the Sub-Asset Classes and underlying Portfolio enhancements. Learn More
Schwab Target 2050 Fund
Fund Profile
| Fund Inception | 01/23/2013 | |
|---|---|---|
| Total Net Assets As of 07/17/2026
|
07/17/2026 | $339,883,823.68 |
| Index Name | Target 2050 Composite Index | |
| Shares Outstanding As of 07/17/2026
|
07/17/2026 | 16,192,669 |
| NAV As of 07/17/2026
|
07/17/2026 | $20.99 |
| Total Holdings As of 06/30/2026
|
06/30/2026 | 22 |
| Portfolio Turnover Rate As of 06/30/2026
|
06/30/2026 | 9.54% |
| Morningstar Category | Target-Date 2050 | |
| Management Style | Active |
Yields
| SEC Yield (30 Day) As of 07/16/2026
|
07/16/2026 | -- |
|---|---|---|
| Distribution Yield (TTM) As of 06/30/2026
|
06/30/2026 | 1.60% |
Fees & Minimum
| Gross Expense Ratio † | 0.570% | |
|---|---|---|
| Net Expense Ratio † | 0.540% | |
| Minimum Initial Investment | No Minimum | |
| 12b-1 Fee | 0.000% |
Fund Characteristics
| Alpha (3 Yr) As of 05/31/2026
|
05/31/2026 | -0.11 |
|---|---|---|
| Beta vs. Benchmark (3 Yr) As of 05/31/2026
|
05/31/2026 | 1.00 |
| R Squared (3 Yr) As of 05/31/2026
|
05/31/2026 | 99.35 |
| Sharpe Ratio (3 Yr) As of 05/31/2026
|
05/31/2026 | 1.20 |
| Standard Deviation (3 Yr) As of 05/31/2026
|
05/31/2026 | 12.03% |
Performance
Total Return
Monthly
-
SWNRX
Cumulative Returns (%)
- 1 Month
- 0.00
- 3 Month
- +12.30
- YTD
- +10.72
Annualized Returns (%)
- 1 Year
- +21.44
- 3 Year
- +17.22
- 5 Year
- +8.84
- 10 Year
- +11.18
- Inception
- +10.38
-
Target-Date 2050 (Morningstar Category)
Cumulative Returns (%)
- 1 Month
- +0.27
- 3 Month
- +13.14
- YTD
- +11.44
Annualized Returns (%)
- 1 Year
- +22.22
- 3 Year
- +17.49
- 5 Year
- +9.25
- 10 Year
- +11.36
-
Target 2050 Composite Index (Index)
Cumulative Returns (%)
- 1 Month
- -0.14
- 3 Month
- +13.07
- YTD
- +10.65
Annualized Returns (%)
- 1 Year
- +21.56
- 3 Year
- +17.41
- 5 Year
- +9.73
- 10 Year
- +11.64
-
Dow Jones U.S. Total Stock Market Index (Index)
Cumulative Returns (%)
- 1 Month
- -0.36
- 3 Month
- +15.72
- YTD
- +11.11
Annualized Returns (%)
- 1 Year
- +23.07
- 3 Year
- +20.44
- 5 Year
- +12.24
- 10 Year
- +15.02
-
Bloomberg US Aggregate Bond Index (Index)
Cumulative Returns (%)
- 1 Month
- +0.24
- 3 Month
- +0.67
- YTD
- +0.62
Annualized Returns (%)
- 1 Year
- +3.79
- 3 Year
- +4.16
- 5 Year
- +0.08
- 10 Year
- +1.54
| Description | Cumulative Returns (%) | Annualized Returns (%) | |||||||
|---|---|---|---|---|---|---|---|---|---|
| 1 Month | 3 Month | YTD | 1 Year | 3 Year | 5 Year | 10 Year | Inception | ||
| SWNRX | 0.00 | +12.30 | +10.72 | +21.44 | +17.22 | +8.84 | +11.18 | +10.38 | |
| Target-Date 2050 (Morningstar Category) | +0.27 | +13.14 | +11.44 | +22.22 | +17.49 | +9.25 | +11.36 | ||
| Target 2050 Composite Index (Index) | -0.14 | +13.07 | +10.65 | +21.56 | +17.41 | +9.73 | +11.64 | ||
| Dow Jones U.S. Total Stock Market Index (Index) | -0.36 | +15.72 | +11.11 | +23.07 | +20.44 | +12.24 | +15.02 | ||
| Bloomberg US Aggregate Bond Index (Index) | +0.24 | +0.67 | +0.62 | +3.79 | +4.16 | +0.08 | +1.54 | ||
Annualized returns for periods 1 yr+/cumulative returns for periods less than 1 yr.
Performance data quoted represents past performance and is no guarantee of future results. Investment returns and principal value will fluctuate so that an investor's shares, when sold or redeemed, may be worth more or less than the original cost. Current performance may be lower or higher than the performance quoted.
Quarterly
-
SWNRX
Average Annual Returns (%)
- 1 Year
- +21.44
- 3 Year
- +17.22
- 5 Year
- +8.84
- 10 Year
- +11.18
- Inception
- +10.38
-
Target-Date 2050 (Morningstar Category)
Average Annual Returns (%)
- 1 Year
- +22.22
- 3 Year
- +17.49
- 5 Year
- +9.25
- 10 Year
- +11.36
-
Target 2050 Composite Index (Index)
Average Annual Returns (%)
- 1 Year
- +21.56
- 3 Year
- +17.41
- 5 Year
- +9.73
- 10 Year
- +11.64
-
Dow Jones U.S. Total Stock Market Index (Index)
Average Annual Returns (%)
- 1 Year
- +23.07
- 3 Year
- +20.44
- 5 Year
- +12.24
- 10 Year
- +15.02
-
Bloomberg US Aggregate Bond Index (Index)
Average Annual Returns (%)
- 1 Year
- +3.79
- 3 Year
- +4.16
- 5 Year
- +0.08
- 10 Year
- +1.54
| Description | Average Annual Returns (%) | |||||
|---|---|---|---|---|---|---|
| 1 Year | 3 Year | 5 Year | 10 Year | Inception | ||
| SWNRX | +21.44 | +17.22 | +8.84 | +11.18 | +10.38 | |
| Target-Date 2050 (Morningstar Category) | +22.22 | +17.49 | +9.25 | +11.36 | ||
| Target 2050 Composite Index (Index) | +21.56 | +17.41 | +9.73 | +11.64 | ||
| Dow Jones U.S. Total Stock Market Index (Index) | +23.07 | +20.44 | +12.24 | +15.02 | ||
| Bloomberg US Aggregate Bond Index (Index) | +3.79 | +4.16 | +0.08 | +1.54 | ||
Annualized returns for periods 1 yr+/cumulative returns for periods less than 1 yr.
Performance data quoted represents past performance and is no guarantee of future results. Investment returns and principal value will fluctuate so that an investor's shares, when sold or redeemed, may be worth more or less than the original cost. Current performance may be lower or higher than the performance quoted.
After Tax Returns
Pre-Liquidation
SWNRX NAV Return
-
SEC Pre-Liquidation
Average Annual Returns (%)
- 1 Year
- +20.05
- 3 Year
- +16.15
- 5 Year
- +7.50
- 10 Year
- +9.89
- Inception
- +9.18
-
SEC Post-Liquidation
Average Annual Returns (%)
- 1 Year
- +13.45
- 3 Year
- +13.35
- 5 Year
- +6.58
- 10 Year
- +8.77
- Inception
- +8.25
-
Tax Cost Ratio
Average Annual Returns (%)
- 1 Year
- +1.39
- 3 Year
- +1.18
- 5 Year
- +1.46
- 10 Year
- +1.31
- Inception
- +1.21
| Description | Average Annual Returns (%) | |||||
|---|---|---|---|---|---|---|
| 1 Year | 3 Year | 5 Year | 10 Year | Inception | ||
| SEC Pre-Liquidation | +20.05 | +16.15 | +7.50 | +9.89 | +9.18 | |
| SEC Post-Liquidation | +13.45 | +13.35 | +6.58 | +8.77 | +8.25 | |
| Tax Cost Ratio | +1.39 | +1.18 | +1.46 | +1.31 | +1.21 | |
After tax returns are based on highest Federal income tax bracket and depend on the investor's tax situation and may differ from those shown, and the after-tax returns shown are not relevant to investors who hold their fund shares through tax-deferred arrangements such as 401(k) plans or individual retirement accounts. State and local taxes are not included. Pre-liquidation figures include taxes on fund's distributions of dividends and capital gains. Tax Cost Ratio represents the percentage-point reduction in returns that results from Federal income taxes (before shares in the fund are sold, and assuming the highest Federal tax bracket).
Target-Date 2050 NAV Returns (Morningstar Category)
-
SEC Pre-Liquidation
Average Annual Returns (%)
- 1 Year
- +19.83
- 3 Year
- +15.88
- 5 Year
- +7.44
- 10 Year
- +9.69
-
SEC Post-Liquidation
Average Annual Returns (%)
- 1 Year
- +13.25
- 3 Year
- +13.12
- 5 Year
- +6.55
- 10 Year
- +8.64
-
Tax Cost Ratio
Average Annual Returns (%)
- 1 Year
- +1.46
- 3 Year
- +1.21
- 5 Year
- +1.56
- 10 Year
- +1.45
| Description | Average Annual Returns (%) | |||||
|---|---|---|---|---|---|---|
| 1 Year | 3 Year | 5 Year | 10 Year | Inception | ||
| SEC Pre-Liquidation | +19.83 | +15.88 | +7.44 | +9.69 | ||
| SEC Post-Liquidation | +13.25 | +13.12 | +6.55 | +8.64 | ||
| Tax Cost Ratio | +1.46 | +1.21 | +1.56 | +1.45 | ||
Post-Liquidation
SWNRX NAV Return
-
SEC Pre-Liquidation
Average Annual Returns (%)
- 1 Year
- +20.05
- 3 Year
- +16.15
- 5 Year
- +7.50
- 10 Year
- +9.89
- Inception
- +9.18
-
SEC Post-Liquidation
Average Annual Returns (%)
- 1 Year
- +13.45
- 3 Year
- +13.35
- 5 Year
- +6.58
- 10 Year
- +8.77
- Inception
- +8.25
-
Tax Cost Ratio
Average Annual Returns (%)
- 1 Year
- +1.39
- 3 Year
- +1.18
- 5 Year
- +1.46
- 10 Year
- +1.31
- Inception
- +1.21
| Description | Average Annual Returns (%) | |||||
|---|---|---|---|---|---|---|
| 1 Year | 3 Year | 5 Year | 10 Year | Inception | ||
| SEC Pre-Liquidation | +20.05 | +16.15 | +7.50 | +9.89 | +9.18 | |
| SEC Post-Liquidation | +13.45 | +13.35 | +6.58 | +8.77 | +8.25 | |
| Tax Cost Ratio | +1.39 | +1.18 | +1.46 | +1.31 | +1.21 | |
After tax returns are based on highest Federal income tax bracket and depend on the investor's tax situation and may differ from those shown, and the after-tax returns shown are not relevant to investors who hold their fund shares through tax-deferred arrangements such as 401(k) plans or individual retirement accounts. State and local taxes are not included. Pre-liquidation figures include taxes on fund's distributions of dividends and capital gains. Tax Cost Ratio represents the percentage-point reduction in returns that results from Federal income taxes (before shares in the fund are sold, and assuming the highest Federal tax bracket).
Target-Date 2050 NAV Returns (Morningstar Category)
-
SEC Pre-Liquidation
Average Annual Returns (%)
- 1 Year
- +19.83
- 3 Year
- +15.88
- 5 Year
- +7.44
- 10 Year
- +9.69
-
SEC Post-Liquidation
Average Annual Returns (%)
- 1 Year
- +13.25
- 3 Year
- +13.12
- 5 Year
- +6.55
- 10 Year
- +8.64
-
Tax Cost Ratio
Average Annual Returns (%)
- 1 Year
- +1.46
- 3 Year
- +1.21
- 5 Year
- +1.56
- 10 Year
- +1.45
| Description | Average Annual Returns (%) | |||||
|---|---|---|---|---|---|---|
| 1 Year | 3 Year | 5 Year | 10 Year | Inception | ||
| SEC Pre-Liquidation | +19.83 | +15.88 | +7.44 | +9.69 | ||
| SEC Post-Liquidation | +13.25 | +13.12 | +6.55 | +8.64 | ||
| Tax Cost Ratio | +1.46 | +1.21 | +1.56 | +1.45 | ||
Cumulative Growth of a $10,000 Investment

| SWNRX (Fund) | $27,682 | |
|---|---|---|
| Target-Date 2050 (Morningstar Category) | $27,998 | |
| Target 2050 Composite Index (Index) | $29,484 | |
| Dow Jones U.S. Total Stock Market Index (Index) | $38,968 | |
| Bloomberg Barclays US Aggregate Bond Index (Index) | $11,582 | |
| Worst Three Months Return (12/31/2019 - 3/31/2020) | -21.26 | |
| Best Three Months Return (3/31/2020 - 6/30/2020) | +19.89 |
This graph represents the growth of a hypothetical investment of $10,000. It assumes reinvestment of dividends and capital gains, and does not reflect sales loads, redemption fees, if applicable, or the effects of taxes on any capital gains and/or distributions. If the inception date of the Index is less than the time period shown above, the Since Inception period is shown. Best and Worst Return cover the timeframe of the chart.
Price Performance
Portfolio
Top Holdings
-
SWPPX
- Name
- SCHWAB S&P 500 INDEX CL SEL
- Percent of Assets (%)
- 19.56%
- Market Value
- $67.4M
-
SWMIX
- Name
- SCHWAB INTERNATI OPRT
- Percent of Assets (%)
- 13.03%
- Market Value
- $44.9M
-
SICNX
- Name
- SCHWAB INTL CORE EQT CL INST
- Percent of Assets (%)
- 9.89%
- Market Value
- $34.1M
-
LGILX
- Name
- SCHWAB SELECT LARGE CAP GROWTH
- Percent of Assets (%)
- 9.27%
- Market Value
- $31.9M
-
DODGX
- Name
- DODGE AND COX STOCK CL I
- Percent of Assets (%)
- 5.74%
- Market Value
- $19.8M
-
SFLNX
- Name
- SCHWAB FND US LG CO INDEX CL INST
- Percent of Assets (%)
- 5.70%
- Market Value
- $19.6M
-
SWSCX
- Name
- SCHWAB SMALL CAP EQT CL SLCT
- Percent of Assets (%)
- 5.38%
- Market Value
- $18.5M
-
GERIX
- Name
- GOLDMAN SAC EMERG MKT EQ CL INST
- Percent of Assets (%)
- 5.22%
- Market Value
- $18.0M
-
SWASX
- Name
- SCHWAB GLOBAL REAL ESTATE CL SLCT
- Percent of Assets (%)
- 4.42%
- Market Value
- $15.2M
-
SWANX
- Name
- SCHWAB CORE EQT
- Percent of Assets (%)
- 4.14%
- Market Value
- $14.3M
| Symbol | Name | Percent of Assets (%) | Market Value | ||
|---|---|---|---|---|---|
| SWPPX | SCHWAB S&P 500 INDEX CL SEL | 19.56%
|
$67.4M | ||
| SWMIX | SCHWAB INTERNATI OPRT | 13.03%
|
$44.9M | ||
| SICNX | SCHWAB INTL CORE EQT CL INST | 9.89%
|
$34.1M | ||
| LGILX | SCHWAB SELECT LARGE CAP GROWTH | 9.27%
|
$31.9M | ||
| DODGX | DODGE AND COX STOCK CL I | 5.74%
|
$19.8M | ||
| SFLNX | SCHWAB FND US LG CO INDEX CL INST | 5.70%
|
$19.6M | ||
| SWSCX | SCHWAB SMALL CAP EQT CL SLCT | 5.38%
|
$18.5M | ||
| GERIX | GOLDMAN SAC EMERG MKT EQ CL INST | 5.22%
|
$18.0M | ||
| SWASX | SCHWAB GLOBAL REAL ESTATE CL SLCT | 4.42%
|
$15.2M | ||
| SWANX | SCHWAB CORE EQT | 4.14%
|
$14.3M |
Asset Allocation
| Asset Class | Percent of Portfolio (%) | |
|---|---|---|
| Stocks | 89.63%
|
|
| Bonds | 9.63%
|
|
| Cash Investments | 0.74%
|
The percentage of assets as shown may not equal 100% due to unsettled trades.
Distributions
Distributions
-
Ex-Date: 12/30/2025
- Record Date
- 12/29/2025
- Payable Date
- 12/30/2025
- Income
- 0.3406
- Short Term Capital Gain
- 0.0000
- Long Term Capital Gain
- 0.6034
- Return of Capital
- --
- Total Distribution
- 0.944000000
-
Ex-Date: 12/30/2024
- Record Date
- 12/27/2024
- Payable Date
- 12/30/2024
- Income
- 0.3147
- Short Term Capital Gain
- 0.0011
- Long Term Capital Gain
- 0.2454
- Return of Capital
- --
- Total Distribution
- 0.561200000
-
Ex-Date: 12/28/2023
- Record Date
- 12/27/2023
- Payable Date
- 12/28/2023
- Income
- 0.2894
- Short Term Capital Gain
- 0.0000
- Long Term Capital Gain
- 0.2277
- Return of Capital
- --
- Total Distribution
- 0.517100000
-
Ex-Date: 12/29/2022
- Record Date
- 12/28/2022
- Payable Date
- 12/29/2022
- Income
- 0.2305
- Short Term Capital Gain
- 0.0000
- Long Term Capital Gain
- 0.8523
- Return of Capital
- --
- Total Distribution
- 1.082800000
-
Ex-Date: 12/30/2021
- Record Date
- 12/29/2021
- Payable Date
- 12/30/2021
- Income
- 0.5282
- Short Term Capital Gain
- 0.0327
- Long Term Capital Gain
- 0.4933
- Return of Capital
- --
- Total Distribution
- 1.054200000
-
Ex-Date: 12/30/2020
- Record Date
- 12/29/2020
- Payable Date
- 12/30/2020
- Income
- 0.1702
- Short Term Capital Gain
- 0.0000
- Long Term Capital Gain
- 0.2040
- Return of Capital
- --
- Total Distribution
- 0.374200000
-
Ex-Date: 12/30/2019
- Record Date
- 12/27/2019
- Payable Date
- 12/30/2019
- Income
- 0.2735
- Short Term Capital Gain
- --
- Long Term Capital Gain
- 0.4254
- Return of Capital
- --
- Total Distribution
- 0.698900000
-
Ex-Date: 12/28/2018
- Record Date
- 12/27/2018
- Payable Date
- 12/28/2018
- Income
- 0.3124
- Short Term Capital Gain
- 0.0010
- Long Term Capital Gain
- 0.4675
- Return of Capital
- --
- Total Distribution
- 0.780900000
-
Ex-Date: 12/28/2017
- Record Date
- 12/27/2017
- Payable Date
- 12/28/2017
- Income
- 0.3646
- Short Term Capital Gain
- --
- Long Term Capital Gain
- 0.0225
- Return of Capital
- --
- Total Distribution
- 0.387100000
-
Ex-Date: 12/29/2016
- Record Date
- 12/28/2016
- Payable Date
- 12/29/2016
- Income
- 0.1781
- Short Term Capital Gain
- 0.0006
- Long Term Capital Gain
- 0.4567
- Return of Capital
- --
- Total Distribution
- 0.635400000
| Ex-Date | Record Date | Payable Date | Income | Short Term Capital Gain | Long Term Capital Gain | Return of Capital | Total Distribution | ||
|---|---|---|---|---|---|---|---|---|---|
| 12/30/2025 | 12/29/2025 | 12/30/2025 | 0.3406 | 0.0000 | 0.6034 | -- | 0.944000000 | ||
| 12/30/2024 | 12/27/2024 | 12/30/2024 | 0.3147 | 0.0011 | 0.2454 | -- | 0.561200000 | ||
| 12/28/2023 | 12/27/2023 | 12/28/2023 | 0.2894 | 0.0000 | 0.2277 | -- | 0.517100000 | ||
| 12/29/2022 | 12/28/2022 | 12/29/2022 | 0.2305 | 0.0000 | 0.8523 | -- | 1.082800000 | ||
| 12/30/2021 | 12/29/2021 | 12/30/2021 | 0.5282 | 0.0327 | 0.4933 | -- | 1.054200000 | ||
| 12/30/2020 | 12/29/2020 | 12/30/2020 | 0.1702 | 0.0000 | 0.2040 | -- | 0.374200000 | ||
| 12/30/2019 | 12/27/2019 | 12/30/2019 | 0.2735 | -- | 0.4254 | -- | 0.698900000 | ||
| 12/28/2018 | 12/27/2018 | 12/28/2018 | 0.3124 | 0.0010 | 0.4675 | -- | 0.780900000 | ||
| 12/28/2017 | 12/27/2017 | 12/28/2017 | 0.3646 | -- | 0.0225 | -- | 0.387100000 | ||
| 12/29/2016 | 12/28/2016 | 12/29/2016 | 0.1781 | 0.0006 | 0.4567 | -- | 0.635400000 |
Documents
SWNRX Prospectus and Other Regulatory Documents
Schwab Target 2050 Fund