Lost Ones: Job Revisions Send a Chill

Last week was arguably the biggest economic data week of the year, with almost a quarter of the S&P 500's market cap reporting second-quarter earnings, the Federal Reserve's rate decision, the August 1st "reciprocal" tariff deadline, and the July jobs report. It ended with a bang given the stunning details of the jobs report: 73,000 payrolls were created, which was weaker than the consensus estimate of 104,000. Much more important, though, was the heavy revision to the prior two months. May's job gains were revised down from 144,000 to 19,000; June's gains were revised down from 147,000 to 14,000 (no, those are not typos).
That means the three-month average of monthly payroll gains has fallen sharply to 35,000, down from 64,000 in June (which, by the way, was 150,000 pre-revision). As you can see in the chart below, 35,000 is a new cycle low and very much consistent with the start of prior recessions.
Payroll gains dropping sharply
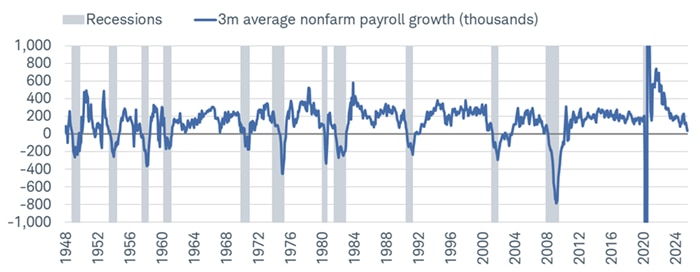
Source: Charles Schwab, Bloomberg, Bureau of Labor Statistics, as of 7/31/2025.
Y-axis truncated for visual purposes.
Also consistent with recessionary behavior is the magnitude of the downward revisions for May and June. As you can see in the chart below, the -258,000 two-month revision is the largest in more than a decade excluding the sharp decline in 2020.
The revisions are not suggestive of anything nefarious happening when it comes to data collection (see the volatility in the chart pre- vs. post-pandemic). Per the Bureau of Labor Statistics (BLS) in July:

"Monthly revisions result from additional reports received from businesses and government agencies since the last published estimates and from the recalculation of seasonal factors."
- Bureau of Labor Statistics
Revisions suggest much shakier ground
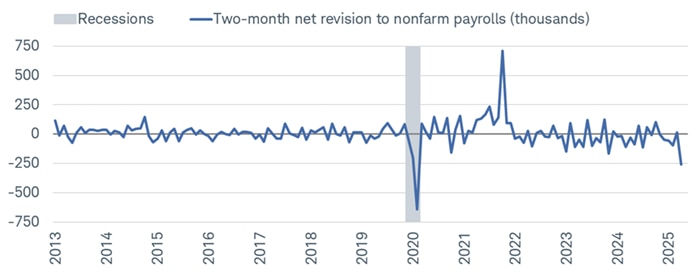
Source: Charles Schwab, Bloomberg, Bureau of Labor Statistics (BLS), as of 6/30/2025.
The unemployment rate remained low relative to history in July but, importantly, did tick higher from 4.1% to 4.2% (taken out three decimal places, it's at a new cycle high). That is important context given the severity of the decline in payroll growth. As shown in the table below, going back to the 1940s, the average three-month gain in nonfarm payrolls at the start of a recession is 96,000. Clearly, we are now well below that. There is more forgiveness with the unemployment rate, since it has averaged 4.7% at the start of recessions; but it's worth noting there is a huge range around that average.
Recessions and employment
- Recession start
- Nonfarm payroll growth (3-month average, thousands)
- Unemployment rate
-
Recession startNov. '48Nonfarm payroll growth (3-month average, thousands)5Unemployment rate3.8%
-
Recession startJuly '53Nonfarm payroll growth (3-month average, thousands)34Unemployment rate2.6%
-
Recession startAug. '57Nonfarm payroll growth (3-month average, thousands)-7Unemployment rate4.1%
-
Recession startApr. '60Nonfarm payroll growth (3-month average, thousands)180Unemployment rate5.2%
-
Recession startDec. '69Nonfarm payroll growth (3-month average, thousands)109Unemployment rate3.5%
-
Recession startNov. '73Nonfarm payroll growth (3-month average, thousands)251Unemployment rate4.8%
-
Recession startJan. '80Nonfarm payroll growth (3-month average, thousands)106Unemployment rate7.2%
-
Recession startJuly '81Nonfarm payroll growth (3-month average, thousands)106Unemployment rate7.2%
-
Recession startJuly '90Nonfarm payroll growth (3-month average, thousands)47Unemployment rate5.5%
-
Recession startMar. '01Nonfarm payroll growth (3-month average, thousands)12Unemployment rate4.3%
-
Recession startDec. '07Nonfarm payroll growth (3-month average, thousands)98Unemployment rate5.0%
-
Recession startFeb. '20Nonfarm payroll growth (3-month average, thousands)208Unemployment rate3.5%
-
Recession startAverageNonfarm payroll growth (3-month average, thousands)96Unemployment rate4.7%
-
Recession startJuly '25Nonfarm payroll growth (3-month average, thousands)35Unemployment rate4.2%
Downward revisions in May and June were large and far-reaching across industries; they're also now showing the hit from the trade war. Shown in the table below are the revisions for overall payrolls and the broad sectors of the economy. The government has been a significant source of weakness, but what also stands out are the sectors that have been advertised as benefiting from re-shoring that is associated with higher tariffs. Revisions in manufacturing and trade & transport have been bleak; and they're getting worse in retail and construction.
Employment revisions by category
*change from initial estimate (thousands)
June 2025 May 2025 Nonfarm Employment -133 -125 Total Private -71 -68 - Goods-producing
-19 -9 - Construction
-12 -4 - Manufacturing
-8 -4 Private Services -52 -59 - Trade & transport
-25 -15 - Retail trade
-17 -8 Information -3 -3 Financial -5 -3 Business Services -4 -23 - Temporary help
0 -10 Education & Health Services 1 -13 Leisure -16 -2 Government -62 -57 - Federal
-2 -1 Supply-side stress
One of the most glaring aspects of the labor market over the past several months has been the stark deterioration in the foreign-born labor force. Over the past four months, it has seen a decline of nearly 1.6 million people, which rivals what we saw during the depths of the COVID-19 pandemic and is nearing a record.
Declines of that magnitude are notable considering foreign-born individuals have been responsible for nearly all labor force growth since the beginning of the pandemic. That brings the potential "speed limit" of the labor market down, meaning the economy can create fewer jobs each month without necessarily seeing the unemployment rate go markedly higher (importantly, though, that also brings potential economic growth down). If there is a structural reason for the drop in labor supply and participation, it could be suggestive that the reduction in supply is offsetting the decrease in labor demand.
Foreign-born labor contracting sharply
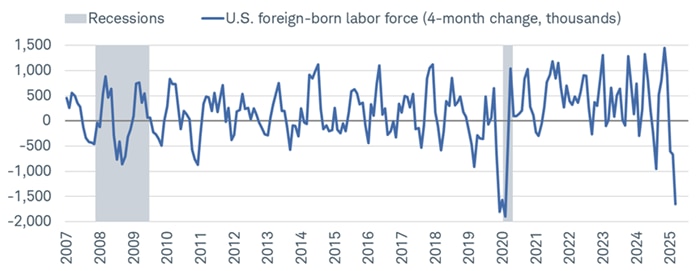
Source: Charles Schwab, Bureau of Labor Statistics (BLS), as of 7/31/2025.
So far, that is consistent with the prime-age employment-to-population ratio staying in a somewhat tight range over the past few years. Its elevated level is suggestive of relatively healthy labor conditions, but we'd note that this doesn't tend to be a strong leading indicator. By the time it's rolling over, a recession is usually well underway.
Employment share still high
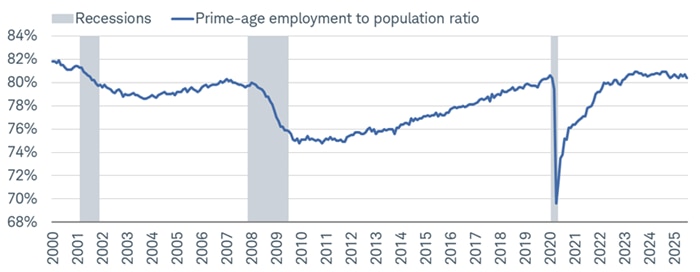
Source: Charles Schwab, Bloomberg, Bureau of Labor Statistics (BLS), as of 7/31/2025.
Initial claims against the grain
One key labor market indicator going against the recession current is initial jobless claims. Released weekly, claims are arguably the best real-time tell we have as to whether companies are laying off individuals en masse. So far, that isn't the case, given current low levels and remarkable stability over the past several years.
Claims remain low for now
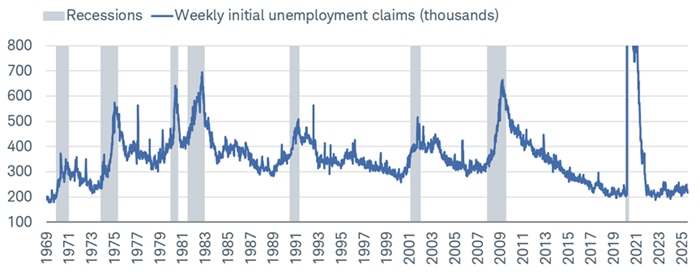
Source: Charles Schwab, Bloomberg, Bureau of Labor Statistics, as of 8/1/2025.
Y-axis truncated for visual purposes.
Continuing claims, which are filed when individuals cannot find a new job and opt to continue receiving unemployment benefits, remain quite high—but that supports the argument that the economy remains in a low-hiring, low-firing mode. The issue is that it's difficult to stay in that mode in perpetuity when pressure is being applied via higher tariffs and restrictive labor policy. We are seeing some of that stress come through, given the share of individuals unemployed for more than 27 weeks rose in July to its highest since the beginning of 2022.
Labor scarring taking effect
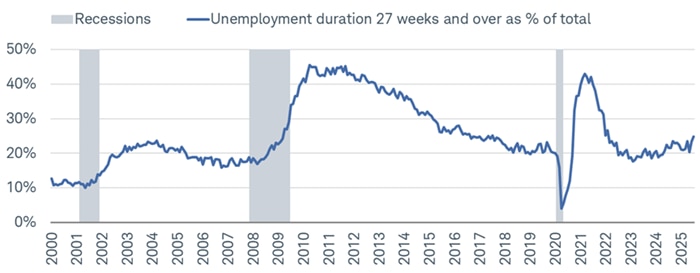
Source: Charles Schwab, Bloomberg, Bureau of Labor Statistics, as of 7/31/2025.
In sum
There was a definitive narrative shift in the economics community on Friday given the severity of the payroll revisions for May and June. As always, no single report should be obsessed over or extrapolated; but if we continue to see a sharp slowdown in job growth and drift higher in the unemployment rate—consistent with the trends from May to July—it would bring forward the possibility that recessionary conditions are forming quickly. In 2008, then Fed chair Alan Greenspan noted "a recession is characterized by significant discontinuities in the data." The past few months of revisions do indeed count as rather significant discontinuities. They also underscore how difficult data-gathering has been in the post-pandemic world, which has likely been exacerbated by layoffs and scarcer resources in the government.
It's logical to see how the impact of the trade war sparked a chilling effect in the labor market in the aftermath of "Liberation Day"—and thus logical to see how businesses continued to err on the side of caution in response. If they viewed the past few months as peak trade uncertainty, perhaps the attendant slowdown in job creation can (to some extent) be looked at in isolation. It's too early to make that determination, though, as we think the business community will continue to deal with an elevated level of instability caused by the mercurial nature of policymaking in Washington.
About the author
 Kevin GordonHead of Macro Research and Strategy