Stocks: Less Comfortably Numb

Since the April 8 tariff-scare low, the story of the S&P 500 has been a powerful index-level rebound masking rotational (and at times fairly punishing) stock-by-stock drawdowns amid narrow leadership. The market has been riding an AI and mega-cap tech boom, Federal Reserve rate cuts and easy financial conditions, and some easing in trade/tariff tensions. By the end of October, the S&P 500 had notched its 36th record high and its longest winning streak in four years.
Fragility
November has been a different story. Last week, the S&P 500 logged its fourth consecutive weekly decline, alongside a rise in the volatility index (VIX) to an intraday high of nearly 28 on Friday. Momentum has clearly faded in AI-driven tech and high-beta stocks, with leadership shifting toward later-cycle and/or more defensive market segments recently. Weakness across cyclicals and services has underscored heighted concerns about the health of the consumer-driven economy.
The table below is a version of one that I post every morning on my X feed. It shows index level returns, across the three major indexes, for two key periods: year-to-date and the period since April 8. As shown in the left side of the table, all three indexes are up year-to-date, with double-digit gains in the case of the S&P 500 and Nasdaq. Where the story gets more interesting is around maximum drawdowns so far this year.
Major indexes and maximum drawdowns
| Index | Index YTD return | Index maximum draw-down from YTD high | Average member maximum draw-down from YTD high | Index return since 4/8/25 low | Index maximum draw-down since 4/8/25 low | Average member draw-down since 4/8/25 low |
|---|---|---|---|---|---|---|
| S&P 500 | 12% | -19% | -27% | 33% | -5% | -18% |
| Nasdaq | 15% | -24% | -51% | 46% | -8% | -41% |
| Russell 2000 | 6% | -24% | -41% | 35% | -9% | -30% |
| Dow Jones | 9% | -16% | -24% | 23% | -6% | -15% |
At the index level, the S&P 500's mid-February through April 8 selloff brought it to within a hair's breadth of bear market territory, while both the Nasdaq and Russell 2000 did meet the bear. Along the way, average member maximum drawdowns were much more extreme at -27%, -51%, and 41%, respectively.
Also shown above, on the right half of the table, is the period since the April 8 low, during which time the S&P 500, Nasdaq, and Russell 2000 are up 33%, 46%, and 35%, respectively. Along the way, although the indexes have only had single-digit drawdowns, the story is more nuanced—and more extreme—at the average member level. In what most investors would describe as a stellar market since April 8, the average member drawdowns are -18%, -41%, and -30%, respectively. It's why we regularly tell investors that the fuller story gets told under the surface of cap-weighted indexes. It also highlights that there are opportunities in the market outside of just the mega-cap tech/AI-related stocks.
Halitosis
In the meantime, the market continues to suffer from some halitosis. One way to measure market breadth is by calculating the percentage of index members outperforming the index itself. Also finding its way on my X feed every morning, the table below shows that only 17% of the S&P 500's constituents have outperformed the index itself over the past six months. The somewhat-good news is that there has been some underlying improvement over the past month, with that reading having more than doubled to 36%.
Percentage of S&P 500 members outperforming S&P 500 index over the past:
- 1m
- 2m
- 3m
- 4m
- 5m
- 6m
- 1y
-
1m36%2m22%3m22%4m19%5m17%6m17%1y24%
It's often said that when only a few generals are on the front line, and most of the soldiers have fallen behind, it's not a strong front. So, it's good to see more of the soldiers marching forward. That should provide some support for better performance by the equal-weight version of the S&P 500. We also believe small caps provide opportunity, but we would lean into profitable vs. unprofitable stocks within the Russell 2000. Since April 8, the 58% of the Russell 2000 that is profitable is up more than 19%; however, the 40% that is unprofitable is up nearly 46%. We would fade (take profits in) the unprofitable segment of small caps. For those keen on the math of 58+40=98, it's currently the cast that 2% of the Russell 2000 are stocks with no earnings data available.
What's up MA
Another way to measure breadth is via moving average comparisons. Currently, only 42% of the S&P 500 and Russell 2000 are trading north of their 50-day moving averages, while it's a more anemic 31% for the Nasdaq. Earlier in the rally off the April 8 closing low, those breadth readings had reach about 80%.
Shown below, at the sector level, Utilities and Energy now have the strongest breadth profiles—both relative to 50-day and 200-day moving averages. Bringing up the rear more recently, what I often call the "growth trio" of sectors (they house the Magnificent 7 group of stocks)—Tech, Consumer Discretionary and Communication Services—have a relatively anemic share of stocks trading above their 50-day moving averages as of last Friday.Waning sector breadth

Source: Charles Schwab, Bloomberg, as of 11/21/25.
Sectors are based on the Global Industry Classification Standard (GICS®), an industry analysis framework developed by MSCI and S&P Dow Jones Indices to provide investors with consistent industry definitions. Indexes are unmanaged, do not incur management fees, costs and expenses and cannot be invested in directly. Past performance is no guarantee of future results.
As shown below in our trademarked sector-based "quilt," performance has been swinging wildly this year; with the notable exception of Tech holding the winning spot during six of the past near-11 months. What a difference November-to-date has made, however, with Tech dropping to the bottom and Health Care jumping from what was last place as recently as July to the top spot month-to-date. We have a favorable view of the Health Care sector heading into next year.
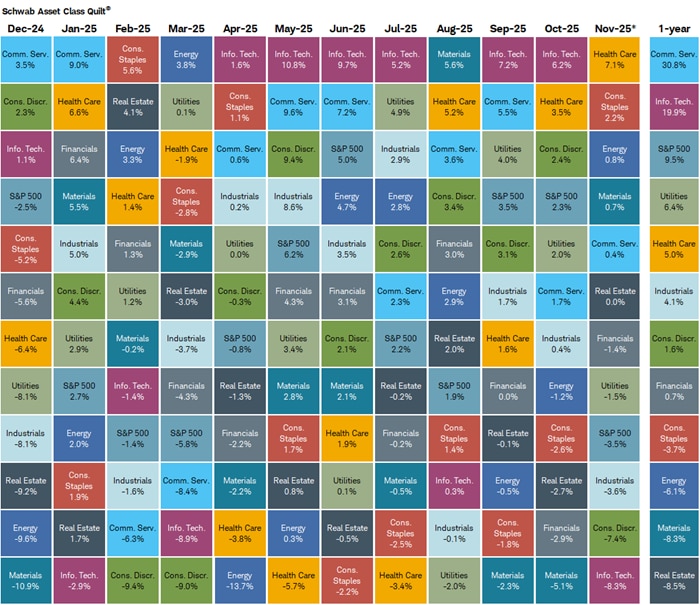
Source: Charles Schwab, Bloomberg. *As of 11/21/25.
Sector performance is represented by price returns of the following 11 Global Industry Classification Standard (GICS®) sector indices: Consumer Discretionary Sector, Consumer Staples Sector, Energy Sector, Financials Sector, Health Care Sector, Industrials Sector, Information Technology Sector, Materials Sector, Real Estate Sector, Communication Services Sector, and Utilities Sector. Returns of the broad market are represented by the S&P 500. Indexes are unmanaged, do not incur management fees, costs and expenses and cannot be invested in directly. Past performance is no guarantee of future results.
Shown below, there has been a stark reversal at the sector level when comparing the period between April 8 and October 28 (marking the latest peak for the S&P 500) to the period since October 28. With a near-72% gain for Tech during the former period, the sector has the worst performance (down nearly 9%) since October 28 through Friday's close. It's close to the opposite for Health Care, which was the second-worst performer between April 8 and October 28, followed by the best performance since.
Sectors' flip-flops
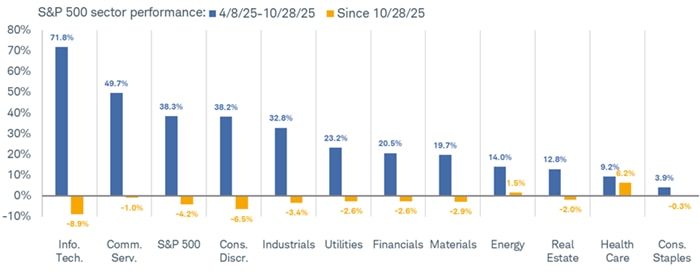
Source: Charles Schwab, Bloomberg, as of 11/21/25.
Sectors are based on the Global Industry Classification Standard (GICS®), an industry analysis framework developed by MSCI and S&P Dow Jones Indices to provide investors with consistent industry definitions Indexes are unmanaged, do not incur management fees, costs and expenses and cannot be invested in directly. Past performance is no guarantee of future results.
Given what we expect to be a continued rotational market, we continue to emphasize factor-based investment decision-making in addition to pure sector-based analysis. Our favorite basket of factors—reminiscent of the days when GARP (growth at a reasonable price) was all the rage—include forward earnings growth, reasonable value, lower volatility, and higher interest coverage.
For now, the macro backdrop in a broad sense continues to be somewhat favorable for stocks (strong earnings, resilient economic growth, and easy financial conditions), but we expect that news-driven bouts of short-term volatility remain likely. We are also mindful of fissures within tech-land; including NVIDIA's failed attempt at a post-earnings rally, the plunge in Oracle's stock, and the sell-off in the Nasdaq 100, which fell last week to below its weekly uptrend support off the early-April lows.
There could be a bit more unwind to go before things settle down. Based on the past five years' trends, there may be a continued deceleration in retail traders' activity. However, as shown below via VandaTrack research, seasonals suggest some stabilization soon following what has been a steep slide since mid-October.
Retail enthusiasm fading

Source: Vanda Research, as of 11/21/2025. RHS represents right hand side.
Assuming the AI boom becomes (or has become) an AI bubble, it has lost a bit of helium. Recent extreme weakness in other retail traders' speculative favorites—including Bitcoin, and baskets like quantum computing, drones, and meme stocks—points to some positioning adjustments underway. As of this writing, a rebound like we're seeing intraday today suggests BTD (buy-the-dip) has not been squashed and seasonals are generally supportive of a year-end rally. However, we would not be surprised to see data/news-based pops of volatility crop up. We are getting our 2026 outlook ready for publication on December 8, so stay tuned for that.
About the authors
 Liz Ann SondersChief Investment Strategist
 Kevin GordonHead of Macro Research and Strategy