Take the Long Way Home: Is Housing Bottoming?

In the post-pandemic era, the best way to characterize the U.S. housing market is out of sync. After going through a mini boom in the dark days of the pandemic—when migration patterns shifted immensely in both size and speed—mortgage rates spiked, affordability weakened, and home sales tumbled—in some cases, by more than 50%. Those sales data were consistent with an overall economic recession, but as most investors are aware, the U.S. economy has not experienced a recession—as defined by the National Bureau of Economic Research (NBER)—since the pandemic; thus keeping housing out of sync.
As shown below, the post-pandemic recovery for both existing and new single-family home sales in year-over-year (y/y) terms has been sluggish. New home sales had a stronger bounce off their pandemic lows, but they constitute a much smaller share of the housing market and thus haven't reflected broad-based strength.
Sales still sluggish
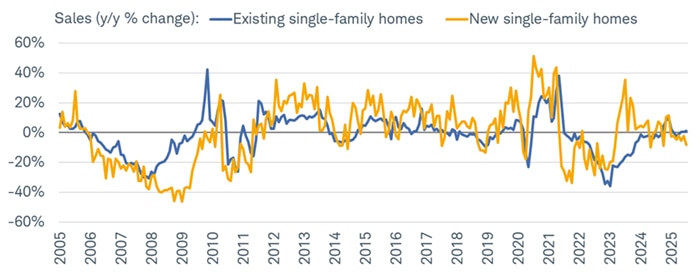
Source: Charles Schwab, Bloomberg, as of 7/31/2025.
Most of the strength in new home sales—relative to existing sales—was driven by a better inventory dynamic. As shown below, the monthly supply of new single-family homes has been much higher than that of existing single-family homes. As a reminder, monthly supply is how many months it would take to sell all homes on the market assuming current selling paces and prices.
The gap between new and existing supply remains incredibly stretched relative to history. Again, with existing homes representing a majority of the market, relatively low supply combined with high median home prices has helped put significant downward pressure on affordability, mainly for new buyers (more on affordability below).
New supply much healthier for now
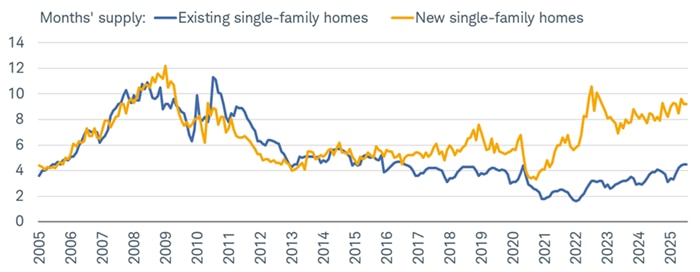
Source: Charles Schwab, Bloomberg, as of 7/31/2025.
The supply crunch hasn't been evenly distributed across the country, though. As shown below, data from Realtor.com show strong growth over the past year for housing inventory in the West. Conversely, inventory growth in the Northeast has been far more sluggish.
Strong inventory growth in West
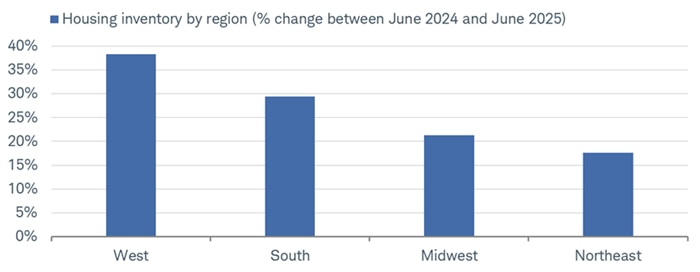
Source: Charles Schwab, Arbor Research & Trading LLC, Realtor.com, as of 6/30/2025.
Home price growth has cooled over the past couple years, but unfortunately, rates of change matter less to buyers in this current environment—especially because of how explosive home price growth was during the depths of the pandemic. As shown below, the median price growth of existing and new single-family homes (three-month moving averages are shown to smooth the data) exceeded 20% y/y at the peak in 2021 and 2022. Despite y/y growth having eased since then, buyers are still reeling from the fact that price levels remain incredibly high.
Price growth stabilizing
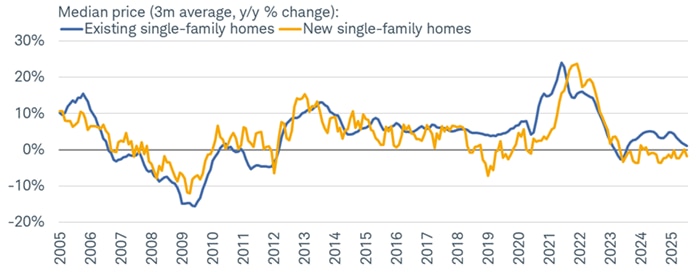
Source: Charles Schwab, Bloomberg, as of 7/31/2025.
Arguably, still-high home prices are the main driver putting downward pressure on the U.S. homeownership rate, which has fallen to a multi-year low and essentially unwound its entire gain since the beginning of the pandemic. Our sense is that—particularly among younger and/or new homebuyers—this metric won't begin to maintain a durable uptrend until mortgage rates come down and home price growth moderates further in the existing home market. That must happen in the context of a labor market that continues to be resilient.
Homeownership rate rolling over
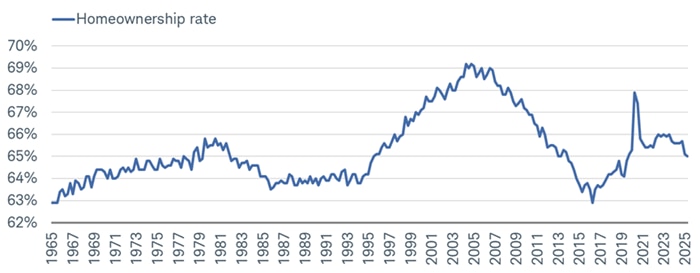
Source: Charles Schwab, Bloomberg, as of 6/30/2025.
The aforementioned housing affordability crisis persists. Shown below, the Housing Affordability Index (HAI) published by the National Association of Realtors (NAR) measures whether a typical family has sufficient income to qualify for a mortgage on a median-priced home. It assumes a 20% down payment and mortgage payments limited to 25% of income.
Depressed affordability
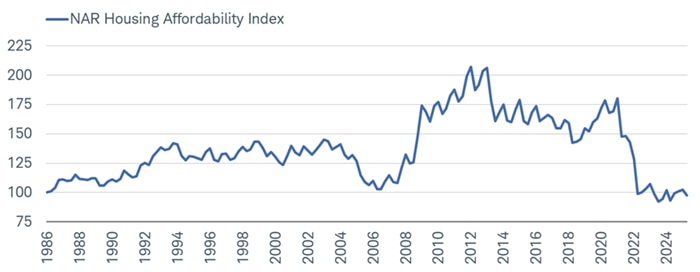
Source: Charles Schwab, Bloomberg, National Association of Realtors (NAR), as of 6/30/2025.
Three-legged stool
There are three major components in housing affordability, including home prices. The ratio of the median price of an existing home to median household income is nearly 5x—even higher than the housing bubble peak in 2006, although it has recently trended lower. But there are ripple affordability effects as well, including property taxes, insurance and utilities.
The second housing affordability component is mortgage rates. As shown below, from a peak of nearly 8% in late-2023, the average 30-year fixed mortgage rate is now about 6.6%. Given the telegraphed likelihood that the Federal Reserve will start cutting the fed funds rate this month, there is an assumption that mortgage rates would come down as well. However, it's the bond market that "controls" the mortgage rate given it's most closely correlated to the 10-year Treasury yield, which is not set by the Fed.
Rates off peak
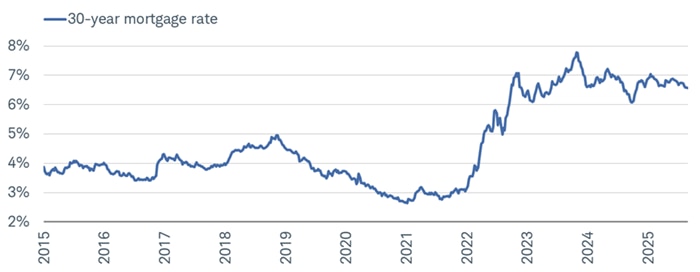
Source: Charles Schwab, Bloomberg, as of 8/29/2025.
During the period last fall when the Fed lowered the fed funds rate by 100 basis points, mortgage rates rose by about 80 basis points. If longer-term yields were to rise alongside lower short-term rates, it would cause a steepening of the yield curve and could elevate the attractiveness of adjustable-rate mortgages (a moribund market for years).
Another way to judge the affordability of mortgages is to look at the monthly hours worked needed to cover the average monthly mortgage payment, shown below. In summary fashion, homeowners need to work nearly 10 days per month (75 hours) to afford the average mortgage payment. In high-cost states like Hawaii and California, that jumps to 17 and 15 days, respectively. In lower-cost states such as West Virginia and Ohio, homeowners need to work less than seven days per month.
Hours to toil to pay mortgage
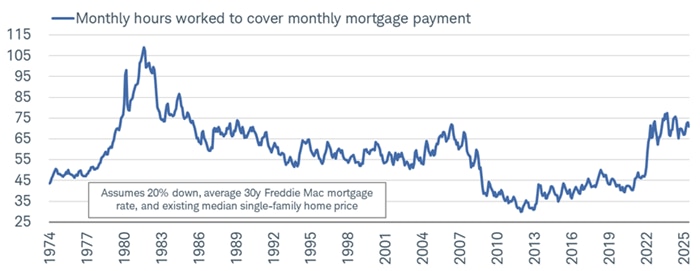
Source: Charles Schwab, Bloomberg, as of 7/31/2025.
The third affordability component is real income growth, which has been trending higher since the inflation-damaged trough in 2022. However, were tariff-related inflation's acceleration to persist, that would put downward pressure on real income growth. Confidence about incomes is probably an underappreciated pillar under the housing affordability stool. Per the HAI chart above, during the decade leading into the pandemic, housing affordability was high, yet housing demand remained relatively moribund. This was in part due to a lower willingness to take on debt in the aftermath of the Global Financial Crisis.
Sentiment stinks
Weak affordability trends have undoubtedly impacted sentiment about the housing market, which remains near an all-time low (since at least the late 1970s). Shown below, the University of Michigan's Survey of Consumers includes a specific index tracking buying conditions for homes—providing insight into consumers' perceptions about whether it's a good time to buy a home, and considering factors like price, interest rates, economic uncertainty, and expected capital gains.
Record low buying conditions
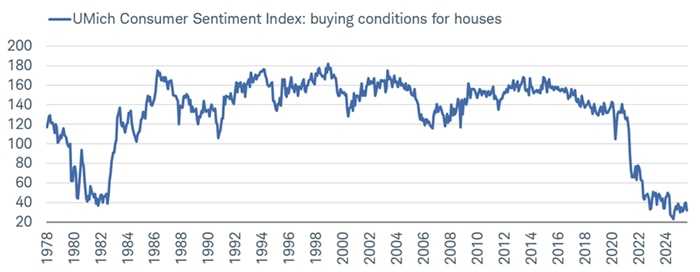
Source: Charles Schwab, Bloomberg, University of Michigan (UMich), as of 8/31/2025.
In sum
The U.S. housing market remains out of synch. Home prices remain high, sentiment remains low and affordability remains constrained. That said, there are some glimmers of hope, including a rising supply of homes and a bit of a rollover in prices. Assuming a further steepening of the yield curve, that would also be supportive of a shift toward variable-rate mortgages, which can help affordability. A healthier balance between supply and demand appear on the horizon.
About the authors

Liz Ann Sonders