Weekly Trader's Outlook

The Week That Was
If you read last week's blog, you might recall that I had a "Moderately Bearish" forecast on the technology sector this week, citing concerns around quarter-end rebalancing and signs of speculative excess (stretched margin debt) and concentrated positioning in the AI infrastructure cohort of the market. The first two days of this week the technology sector rebounded nicely, which may have been due to some quarter-end "window dressing" by fund managers. However, once the calendar flipped to the new quarter, selling began to emerge in the tech space (perhaps partly fueled by money rotating into other areas of the market) and particularly in the semiconductor space. The PHLX Semiconductor Index (SOX) is down 12% over the last two days, in part due to a sharp overnight drop (-7.89%) in the Korea Composite Stock Price Index (KOSPI). Perhaps chip stocks are finally encountering a solid mean reversion correction given the 100% rally in the SOX for the first six months of this year. However, the sharp pullback could end up being another buying opportunity in a longer-term uptrend, we should have a better sense next week.
Regarding the U.S.-Iran negotiations, the ceasefire is not going great, but oil prices remain below $70/barrel and markets remain hopeful of a resolution. Reports indicated that "positive progress" was established during this week's indirect technical talks between the two countries in Doha, but the status of the Strait of Hormuz remains unclear. Earlier today Iran's military headquarters warned that any US interference in the Strait would be met with a "decisive and swift response."
Kevin Warsh spoke this week at the European Central Bank (ECB) forum, but the Federal Reserve chair was tight-lipped around forward monetary guidance, and he reiterated his commitment to getting inflation down to the Fed's 2% target.
Outlook for Next Week
At the time of this writing (3:05 p.m. ET) stocks are mixed, with heavy selling still plaguing the technology sector (DJI + 320, SPX - 40, $COMP - 353, RUT - 35). The sentiment around the artificial intelligence (AI) trade feels a little sour at this point, but its possible that the recent weakness is just wringing out the excess in the market and balancing what used to be lopsided positioning in the space. Outside of the AI theme, the broadening of the rally still appears to be underway, as the economic data and growth forecasts remain strong. Next week will be light on both the economic and earnings calendar, so near-term technicals, Middle East headlines, oil prices, and yields will likely have a larger influence on market direction. July seasonality favors the bulls, but I'm wondering if that will be enough of a factor to offset the wobble we're seeing in the momentum/AI infrastructure trade. The near-term technicals look bifurcated from my lens–the S&P Equal Weight Index (SPXEW), Russel 2000 (RUT), and Dow Jones Industrial Average (DJI) look bullish, but the Nasdaq Composite ($COMP) is dropping back below its 50-day Simple Moving Average (SMA) today, and the SOX firmly broke its uptrend today (more on this in the "Technical Take" section below). The Nasdaq 100 (NDX) is just above its 50-day SMA at the time of this writing, so more time is needed to make a technical determination. On the one hand, I could see a bounce in the chips stocks early in the week given the two-day 12% drop in the SOX, but I'm not sure how sustainable that bounce would be given the recent technical deterioration. Therefore, I'm providing a "Higher Volatility" forecast for the overall market next week, with a "cautious" stance on tech. I understand that it's the summer, which generally implies lower volatility, but the current environment still leaves room for several potential catalysts in my view–is positioning in AI infrastructure still concentrated, or have we corrected enough? What about margin debt levels? What if U.S./Iran relations flare back up, or oil prices begin to turn higher? In any event, and more importantly, I hope everyone has a safe and happy Fourth of July celebration.
Other Potential Market-Moving Catalysts
Economic:
- Monday (July 6): ISM Non-Manufacturing Index
- Tuesday (July 7): Trade Balance
- Wednesday (July 8): Consumer Credit, EIA Crude Oil Inventories, MBA Mortgage Applications Index, Wholesale Inventories
- Thursday (July 9): Continuing Claims, EIA Natural Gas Inventories, Existing Home Sales, Initial Claims
- Friday (July 10): no reports
Earnings:
- Monday (July 6): Barnes & Noble Education Inc. (BNED), NovaBridge Biosciences (NBP), US Gold Corp. (USAU)
- Tuesday (July 7): Enerpac Tool Group Corp. (EPAC), Kura Sushi USA Inc. (KRUS), Penguin Solutions Inc. (PENG), Saratoga Investment Corp. (SAR)
- Wednesday (July 8): AZZ Inc. (AZZ), Helen of Troy Ltd. (HELE), Immersion Corp. (IMMR), Levi Strauss & Co. (LEVI), PriceSmart Inc. (PSMT)
- Thursday (July 9): Byrna Technologies Inc. (BYRN), Frequency Electronics (FEIM), Nurix Therapeutics Inc. (NRIX), PepsiCo Inc. (PEP), WD-40 Co. (WDFC)
- Friday (July 10): no reports
Economic Data, Rates & the Fed
There was a solid dose of economic data for markets to digest this week, which was highlighted by several readings on the labor market. First, the monthly Nonfarm Payrolls report came in below estimates, and the prior two months were revised down by 74K, so the data likely provides the Fed with more room to be patient with any potential rate hikes. The labor market isn't flashing any warning signs though, as evidenced by the continued string of subdued jobless claims, and job openings are abundant (JOLTs came well above estimates). Also noteworthy was a significant downward revision to the Atlanta Fed's Nowcast for Q2 GDP (from 2.5% to 1.2%), though that appears to be driven by weak net exports. Here's a breakdown of the reports:
- Nonfarm Payrolls: Headline payrolls rose by 57,000 in May, which was below the +113,000 economists were expecting. Additionally, payrolls were revised lower by 74,000 over the past two months.
- Unemployment Rate: Ticked down to 4.2% in May from 4.3% in the prior month and below the 4.3% expected.
- Average Hourly Earnings: Average hourly earnings increased 0.3% month-over-month and +3.5% on a year-over-year basis (both in-line with estimates).
- Labor Force Participation: Slipped to 61.5% in May from 61.8% the prior month, which represents a five-year low.
- Average Workweek: 34.3 versus 34.3 expected.
- ADP Employment Change: U.S. private employers added 98K jobs in June, down from 122K in May and below the +110K expected. Job creation was led by the education and health services sector.
- JOLTs-Job Openings: Increased by 9,000 in May from the prior month to 7.594M, which was above the 7.30M economists were expecting. This represents the highest figure since May of 2024.
- ISM Manufacturing Index: Decreased to 53.3% in June from 54.0% in May, remaining in expansionary territory for the sixth consecutive month. The Prices Index decreased to 73 in June from 82.1 in May but remains in expansion or "increasing" territory.
- S&P Global U.S. Manufacturing PMI: Dropped to 53.9 in June from 54.1 in May, which was below the 55.7 economists were expecting.
- Factory Orders: -1.3% vs. 2.0% est.
- Chicago PMI: 56.7 vs. 55.0 est.
- Consumer Confidence: 91.2 vs. 93.9 est.
- Construction Spending: 0.1% vs. 0.6% est.
- EIA Crude Oil Inventories: -3.78M barrels.
- EIA Natural Gas Inventories: +76 bcf.
- Initial Jobless Claims: Initial applications for U.S. jobless benefits decreased 1K from last week's (upwardly revised) 216K to 215K, which was below the 225K economists had expected. Continuing Claims ticked up slightly from the prior week to a seasonally adjusted 1.814M.
- The Atlanta Fed's GDPNow "nowcast" for Q2 GDP was revised down to 1.2% yesterday from 2.5% last Friday, primarily due to a downward revision to net exports.
U.S. Treasuries increased across the board this week, which appeared to be driven by yesterday's relatively hawkish commentary from Fed Chair Kevin Warsh. Markets were probably expecting Warsh to convey a more dovish tone since the U.S. and Iran signed a memorandum of understanding (MOU), and the subsequent drop in oil prices since Warsh's first Federal Open Market Committee (FOMC) meeting. Compared to last Friday, two-year Treasury yields moved up ~4 basis points (4.129% vs. 4.088%), 10-year yields increased ~10 basis points (4.479% vs. 4.372%), and 30-year yields jumped ~13 basis points (4.985% vs. 4.865%).
Market expectations around a potential rate hike from the Federal Reserve pulled back this week, which is likely due to the soft jobs report, along with a continued decline in oil prices. Per the Bloomberg rate probabilities, the probability of a rate hike at the July FOMC is down to 20% from 30% last week, and the theoretical 100% probability of a rate hike remains at the December FOMC meeting.
Technical Take
PHLX Semiconductor Index (SOX - 921 to 12,431)
At the heart of the AI infrastructure trade are chip stocks, and the sector has been on fire for the first six months of 2026. However, the third quarter is off to a bad start for the PHLX Semiconductor Index (SOX) as the index is down nearly 7% today, and over 12% over the past two days. Today's selloff in the SPX can in part be blamed on the nearly 8% overnight drop in the memory-heavy Korea Composite Stock Price Index (KOSPI). Prior to today, the SOX had found support around the 20-day Simple Moving Average (the aqua line in the chart below), but today that support is absent. Whether you draw an uptrend line or use the 20-day SMA as a gauge of the uptrend, today looks like a clean break of that uptrend and the technicals have shifted in favor of the bears, in my view. The index appears to be approaching its 50-day SMA, which could provide some support if it gets there, but it's important to keep in mind that the SOX just registered its strongest six-month rally in history, so this is not your average uptrend. Given the sharp two-day sell-off in the SOX (-12.74%), a mean reversion bounce in the first half of next week wouldn't surprise me, but the technicals look bearish at this point in time.
Near-term technical translation: on watch for oversold bounce
Intermediate-term technical translation: bearish
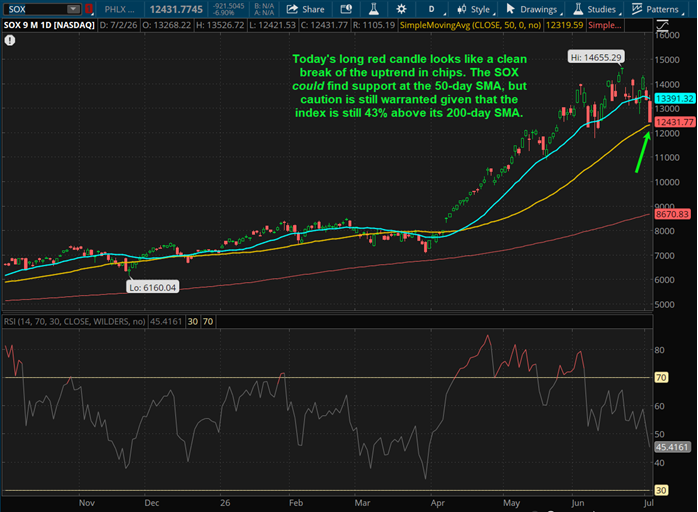
Source: ThinkorSwim trading platform
Past performance is no guarantee of future results.
S&P Equal Weight Index (SPXEW + 14 to 8,661)
The S&P Equal Weight index (SPXEW) notched another fresh all-time high this week, supporting the notion that the rally in stocks is seeing broader participation. Near-term the index may be a little bit stretched (as indicated by the distance between price and the 20-day SMA), so a move back toward the 20-day SMA wouldn't surprise me, but the intermediate-term trend is firmly bullish.
Near-term technical translation: neutral
Intermediate-term technical translation: bullish
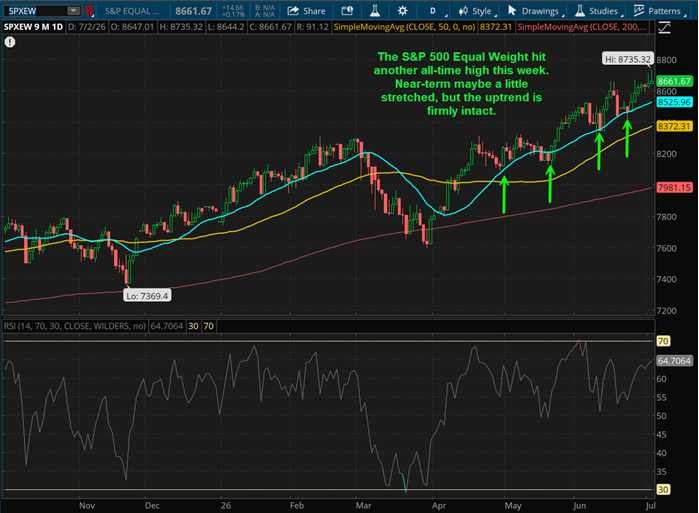
Source: ThinkorSwim trading platform
Past performance is no guarantee of future results.
Cryptocurrency News
The Bitwise 10 Large Crypto Index is up 4% since last Friday, with bitcoin up 3% and ether up 8% at the time of writing. Amid the recent plunge to $58,000, bears have become more vocal. While hawkish shifts in fed funds futures and rising real yields have impacted cryptocurrencies and commodities broadly, on-chain data provides a positive signal.
Bitcoin mining difficulty fell roughly 20% from its October peak to its February low. After recovering into early May, it began falling again as miners temporarily shut down amid the selloff. After reaching February levels, the latest difficulty adjustment was 5% higher, a signal that has historically confirmed the bottom is in, with miners re-entering the network.
While macro may be the latest force impacting crypto markets, it's important not to forget that bitcoin is ultimately a low-correlation asset. While a strong dollar is often a headwind, for most of this year, bitcoin exhibited a positive correlation to the dollar. Starting points matter and this may be due to bitcoin already being down 50% from its highs. Fears of rising real yields and a strong dollar over the next year may not have the impact bears assume they will.
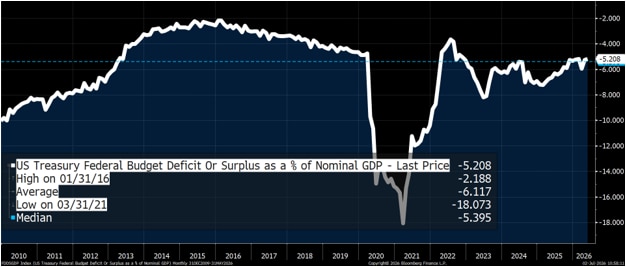
One narrative that has come into focus in recent weeks is that the Fed has put a check on the debasement trade. Putting that narrative in perspective, much of last year's gold rally was due to supply-constrained precious metals getting a momentum bid, as opposed to actual debasement. Seasoned bitcoin investors know this feeling very well—euphoric blow off tops followed by crushing bear markets. While total U.S. debt is now larger than the U.S. economy, it would be difficult to find an investor who had not seen that coming for many years now. In terms of debasement, the budget deficit as a percent of nominal GDP continues to shrink and is below its median level since bitcoin was launched in 2009. While this should not be interpreted as a defense of the U.S. government's fiscal health, the reason gold may have corrected is because the rally last year was driven by narratives and momentum, not data and fundamentals.
Historically, an increase in mining difficulty has confirmed the bottom is in after a selloff
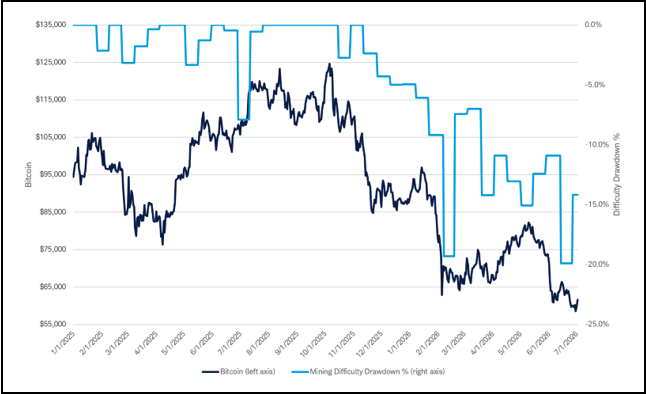
Source: Glassnode, Schwab as of 7/2/2026
Bitcoin does not always have an inverse correlation to the Dollar
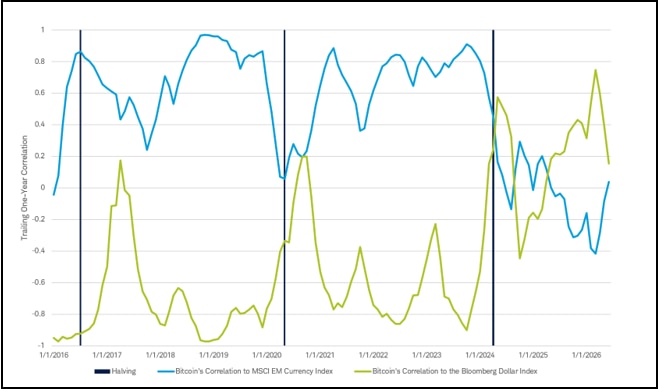
Source: Bloomberg LP, Schwab as of 7/2/2026
Demand for downside protection through puts has moderated
Source: Bloomberg LP, Schwab as of 7/2/2026
Market Breadth
The Bloomberg chart below shows the current percentage of members within the S&P 500 (SPX), Nasdaq Composite (COMP), and Russell 2000 (RUT) that are trading above their respective 200-day Simple Moving Averages (SMA). In short, the S&P 500 Equal Weight index (SPXEW) and Russell 2000 (RUT) notched fresh all-time highs this week, which conveys the broadening theme, and market breadth improved along with the move higher in stocks. The Russell 2000 is approaching its highs from January when it hit 71.54%. Compared to last Friday, the SPX (white line) breadth ticked up to 63.92% from 63.00%, the COMP (blue line) eased to 49.02% vs. 44.72%, while the RUT (red line) declined to 67.98% from 64.43% (all week-over-week).
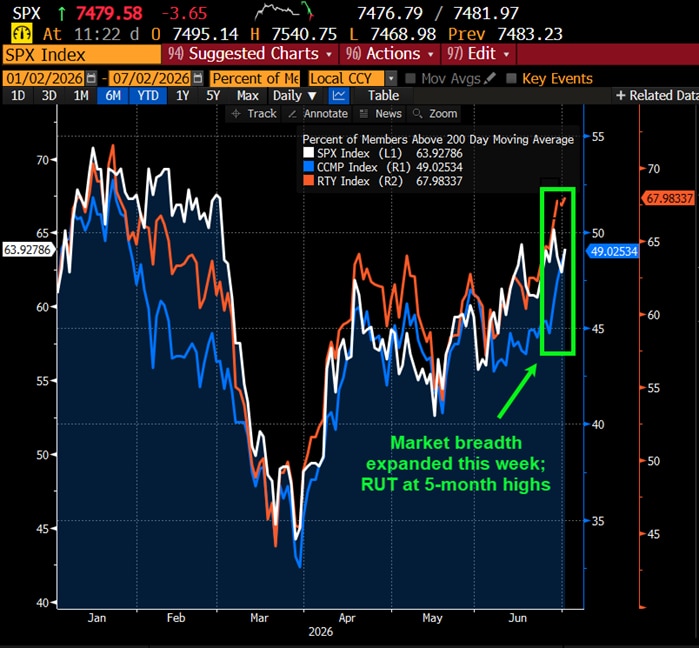
Source: Bloomberg L.P.
Market breadth attempts to capture individual stock participation within an overall index, which can help convey underlying strength or weakness of a move or trend. Typically, broader participation suggests healthy investor sentiment and supportive technicals. There are many data points to help convey market breadth, such as advancing vs. declining issues, percentage of stocks within an index that are above or below a longer-term moving average, or new highs vs. new lows.
This Week's Notable 52-week Highs (264 today): Abbvie Inc. (ABBV + $8.03 to $259.09), Allstate Corp. (ALL + $4.84 to $247.96), Camden Property Trust (CPT + $0.98 to $116.64), Guardant Health Inc. (GH - $1.64 to $169.13), Humana Inc. (HUM - $4.72 to $404.69), Welltower Inc. (WELL + $3.83 to $234.02)
This Week's Notable 52-week Lows (24 today): Adient PLC (ADNT + $0.40 to $18.54), American Tower Corp. (AMT + $0.82 to $166.90), AT&T Inc. (T - $0.15 to $20.33), Group 1 Automotive Inc. (GPI - $6.62 to $279.97), Korger Company (KR + $1.29 to $57.53), Las Vegas Sands Inc. (LVS + $0.49 to $46.74)
About the author
