The AI Innovation Cycle: Scenarios and Signposts
Key takeaways
- The artificial intelligence (AI) innovation wave is proceeding quite rapidly relative to historical technological breakthroughs. Models are evolving quickly and the amount of capital spending (capex) for the underlying infrastructure has soared, with the potential to become one of the largest in history, based on academic forecasts.
- We remain in the early stages of this innovation wave. How AI evolves remains highly uncertain. In this article, we present four potential scenarios: (1) productivity boom, (2) delayed payoff, (3) inflationary boom, and (4) deflationary bust.
- We're tracking these scenarios across a range of measures (or signposts) that fall into the categories of capex, financing, adoption, and economic payoff/monetization. Currently, capex remains strong but questions about the ability to finance it have risen while adoption and monetization are still in the early stages.
- Across global equities, the U.S. and emerging markets have the largest exposures to AI, while Europe and Japan are more company specific. Individual industries have both opportunities and risks associated with the evolution of AI. Companies may need to evolve with AI, sometimes disrupting existing businesses, or being disrupted themselves. For investors, diversification, selectivity, and flexibility may become increasingly important and market leadership may change over time.
- The U.S. midterm election outcome has added a new source of uncertainty to the AI cycle, with regulation and growing opposition to data-center development potentially slowing the pace of investment and adoption. These risks, alongside market weakness in semiconductor and AI supply chain equities (the Bloomberg AI Value Chain Equal Weight Index is down 22% so far this quarter) raise the probability of a delayed payoff and a deflationary bust relative to our other scenarios.
Artificial intelligence (AI) has the potential to become one of the largest innovation waves in history in terms of capital investment (capex), related earnings growth, and for debt and equity capital markets. Indeed, the ongoing capex boom ranks among the largest and fastest in history. Yet, like past periods of technological breakthroughs, there are likely to be rolling phases to this innovation cycle where the ultimate outcomes are highly uncertain. Indeed, even the leaders of the companies at the forefront of AI admit they don't know how this technology will impact the world.
Research from academics that builds on work from Carlota Perez and Joseph Schumpeter coalesces around the idea that major technological innovation waves tend to move through recurring stages: breakthrough, speculative investment, crash or reset, productivity lag, deployment, and mass diffusion. From our perspective, we're currently experiencing features of both the breakthrough and speculative investment phases. AI capabilities are advancing rapidly, but the physical buildout requires chips, memory, data centers, power, cooling, networks, etc. All of this buildout requires financing—and lots of it.
From our perspective, the outcomes—for society at large, the business sector, and financial markets—remain quite uncertain. Major factors include not only how the AI models themselves advance but how quickly data center and power needs are met, how the broader business sector is able to leverage the technology, and how it all gets paid for. Because of this uncertainty, we are tracking the broad AI innovation wave through scenario analysis that covers four potential scenarios: (1) a productivity boom, (2) delayed payoff, (3) an inflationary boom, and (4) deflationary bust.
We see core tensions revolving around the timing of these dynamics: significant capital is being spent well ahead of the value that's expected to be generated. AI's capabilities could continue to advance but if companies aren't able to translate these advancements into revenue growth and increased productivity, the payoff may be delayed or unrealized altogether.
The AI innovation wave is still in its early innings, and we expect the playing field to change as adoption, costs, revenues, and the models themselves continue to evolve. Based on the trends we see today, we believe the delayed payoff and inflationary boom scenarios are most likely. Productivity boom is an upside scenario, and deflationary bust is a downside scenario. However, the U.S. midterm election results and growing opposition to data center construction could potentially slow the pace of investment and adoption. This could raise the probability of a delayed payoff and a deflationary bust relative to other scenarios.
We're tracking these scenarios across a range of metrics that center on the following categories: capex, financing, adoption, and economic payoff/monetization.
Possible outcomes of the AI innovation cycle
| Scenarios: | 1. Productivity boom | 2. Delayed payoff | 3. Inflationary boom | 4. Deflationary bust |
|---|---|---|---|---|
| Technology & adoption | AI models improve; costs decline; adoption and deployment spread rapidly. | Adoption is slower than expected due to insufficient returns, regulations, or cybersecurity concerns; supply bottlenecks could slow buildout. | Investments in power, grid equipment, memory, and construction lag broader AI adoption. | Capacity outruns durable demand; pricing falls faster than volumes. |
| Capital cycle | Capex growth slows, but continues for longer given high returns on invested capital (ROIC). | Capex and order backlogs grow; compute prices fall, but monetization and productivity lag. | High capex increasingly relies on equity, debt, and off-balance sheet financing. Cost of capital rises. | Utilization and revenue miss depreciation and funding hurdles; projects are cut or deferred. |
| Macro & market pattern | Higher real growth, broadening earnings growth, productivity gains, disinflationary forces. | Capex supports growth, but cash-flow pressure and return dispersion create market volatility; productivity gains lag. | Strong nominal growth, sticky inflation, and higher real rates before productivity relief. | Capex downturn, tighter financial conditions, and later disinflation from excess capacity. |
| Confirming signposts | AI adoption and spending expands; quantified savings; output per hour increases; profit margins improve across industries. | AI adoption broadens, but few firms quantify earnings impact; slow backlog conversion. | Power scarcity; equipment lead time; high construction costs; reliance on outside financing. | Falling rental rates/utilization; cancellations; capex cuts; wider interest rate spreads; asset write downs. |
AI scenario signposts
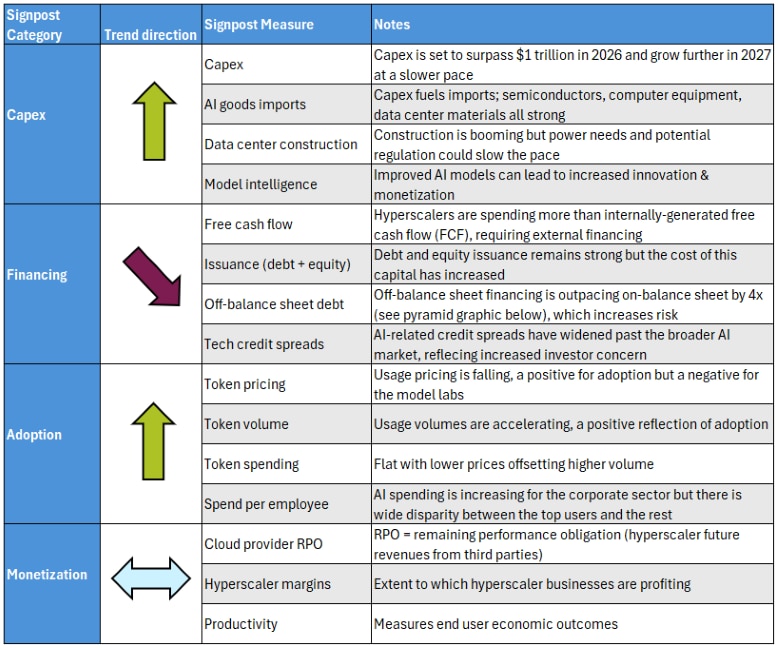
Source: Schwab Center for Financial Research, as of 11/4/2026.
For illustrative purposes only.
Signpost 1: Capital spending
AI infrastructure spending continues to rise, although the pace of growth may slow in 2027. Permitting delays, community opposition, and shortages of power, equipment, labor, and financing could constrain the buildout.
Hyperscalers are large cloud service providers that provide computing, storage, and networking infrastructure, including data centers and servers needed to support AI. Hyperscalers have funded most capacity and have lower cost of capital than smaller players, while neoclouds provide incremental capacity to hyperscalers, with less durable funding.
Capex could slow if supply catches demand, models become more efficient, competitors consolidate, or investor risk appetite weakens. Capex could accelerate if adoption broadens and users demonstrate higher revenue or lower costs.
What we're watching to determine the trend and direction of the capex signpost: Capital expenditures; data center and power capacity under construction and energized; project completion/delays; semiconductor imports and prices; access to skilled labor; data center opposition; and AI model capabilities.
Data center capex continues to grow but the pace of growth may slow
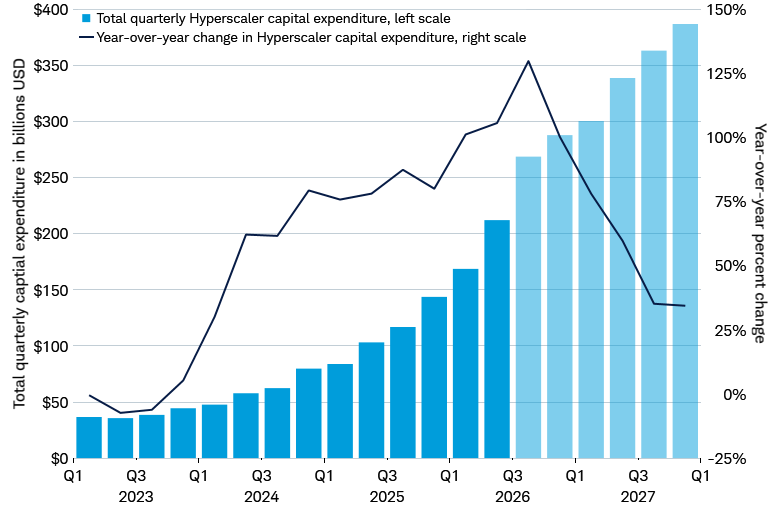
Source: Schwab Center for Financial Research, Bloomberg, and Macrobond data as of 11/3/2026.
Quarterly data from first quarter of 2023 through second quarter of 2026, and consensus forecasts for the third and fourth quarters of 2026 and the four quarters of 2027.
Hyperscaler grouping includes Alphabet, Amazon, Microsoft, Meta, Oracle, and SpaceX, and larger neoclouds CoreWeave and Nebius Group.
All corporate names and market data shown are for illustrative purposes only and are not a recommendation, offer to sell, or a solicitation of an offer to buy any security. Forecasts contained herein are for illustrative purposes only, may be based upon proprietary research and are developed through analysis of historical public data.
Signpost 2: Financing
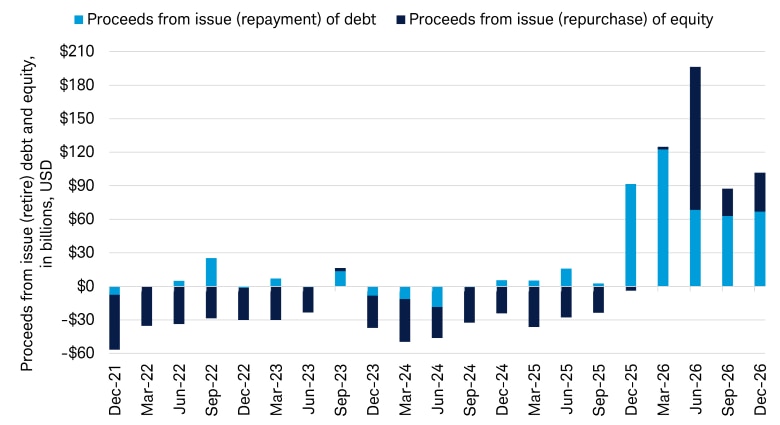
Hyperscalers initially funded the AI buildout from operating cash flow, but heavy capex has dramatically reduced free cash flow (FCF), or operating cash flow less capex. This has pushed some companies toward debt, equity, leases, and structured financing. Because investment precedes revenue by years, continued expansion depends on investors' willingness to fund the gap in a leap of faith.
Hyperscalers are less able to fund spending with internally generated cash
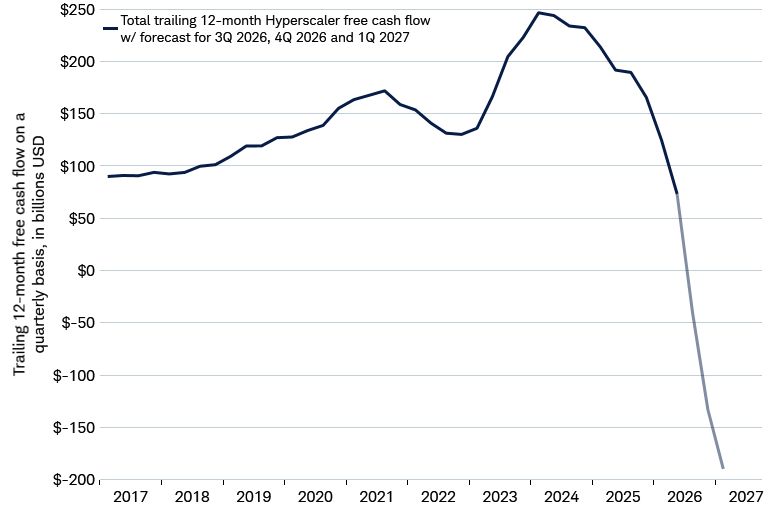
Source: Schwab Center for Financial Research, Bloomberg, and Macrobond data as of 11/3/2026.
Trailing 12-month free cash flow on a quarterly basis for hyperscalers quarters ending first quarter 2017 to second quarter 2026, and forecasted free cash flow for the third quarter and fourth quarters of 2026 and first quarter of 2027.
Hyperscaler grouping includes Alphabet, Amazon, Microsoft, Meta, Oracle, and SpaceX, and larger neoclouds CoreWeave and Nebius Group.
All corporate names and market data shown are for illustrative purposes only and are not a recommendation, offer to sell, or a solicitation of an offer to buy any security. Forecasts contained herein are for illustrative purposes only, may be based upon proprietary research and are developed through analysis of historical public data.
Debt and equity issuance has risen sharply, while higher yields, delayed or canceled initial public offerings (IPOs), and credit-rating pressure suggest markets are becoming more selective. Financing for neoclouds, which provide incremental capacity to hyperscalers and are smaller in nature, is another vulnerability: delayed capacity could cause hyperscalers to miss capacity and revenue targets. Alternatively, increased conviction about profit expectations could ease financing conditions.
Hyperscalers have gone from retiring debt and equity to issuing debt and equity
Source: Schwab Center for Financial Research and Bloomberg, as of 11/4/2026.
Quarters ending December 2021 to December 2026. The quarter ending December 2026 includes deals priced through 11/4/2026 and excludes any potential repayments of debt or stock buybacks.
Hyperscalers here include Alphabet, Amazon, Microsoft, Meta, Oracle, and SpaceX, in addition to neoclouds CoreWeave and Nebius Group.
All corporate names and market data shown are for illustrative purposes only and are not a recommendation, offer to sell, or a solicitation of an offer to buy any security.
What we're watching to determine the trend and direction of the financing signpost: Free cash flow; debt and secondary equity issuance; completed, delayed, or withdrawn IPOs; operating profits relative to interest payments (interest coverage); purchase, lease, and power commitments; and credit spreads and broader financial conditions.
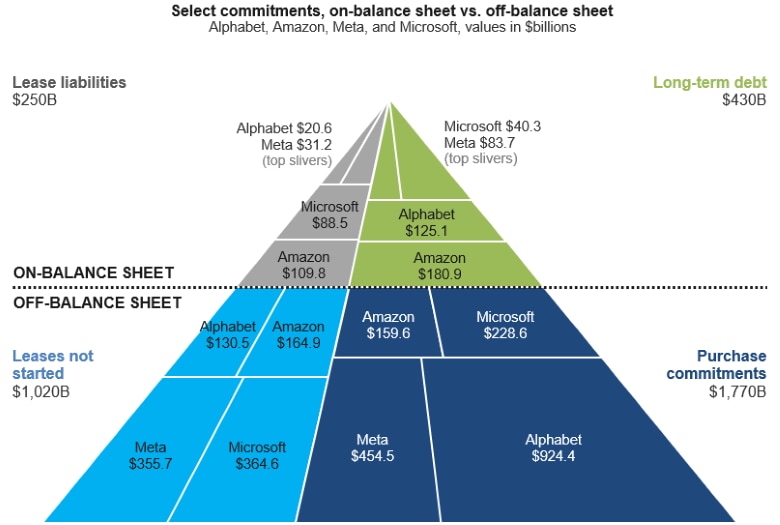
Off-balance sheet obligations are a future use of cash not included on balance sheets
Source: Schwab Center for Financial Research, company 10-Q and 10-K filings.
Data are in billions and are based on September 2026 quarterly filings, except for Microsoft purchase commitments, lease liabilities, long-term debt, and Alphabet and Amazon lease liabilities, which are based on June 2026 quarterly filings. Aggregate figures are rounded. Data as of 11/3/2026. Graphic inspired by Wall Street Journal article dated 8/16/2026.
All corporate names and market data shown are for illustrative purposes only and are not a recommendation, offer to sell, or a solicitation of an offer to buy any security.
Signpost 3: AI adoption
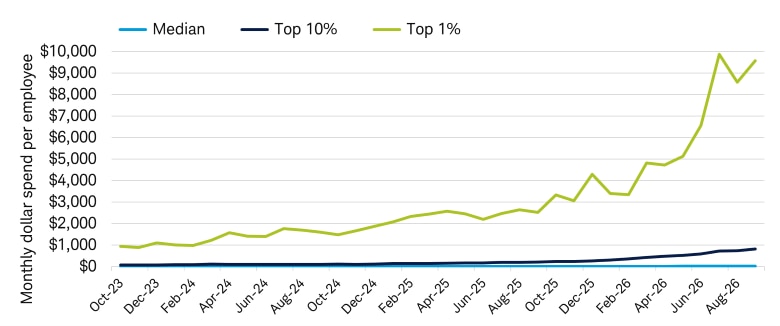
AI usage is increasing as measured by tokens, a unit of data or compute when using AI models. Greater usage is aided by lower token prices and lower-cost open-weight models that encourage increased volume. Yet business token spending has recently leveled off, and adoption remains concentrated among early users. Data from the financial platform Ramp shows a wide spending gap between the top 1% of corporate adopters and the median company.
If adoption fails to broaden, demand may not absorb planned capacity. Conversely, wider production use and clearer revenue or cost benefits could support additional investment. New use cases or applications will likely be important to justify sustained spending.
What we're watching to determine the trend and direction of the AI adoption signpost: Token prices, volume, and spending; graphics processing unit (GPU) rental rates; dynamic random-access memory (DRAM) prices; installed accelerator capacity; enterprise AI spending; and the capability gap between frontier (proprietary) and open-weight models.
The median company spends a fraction of what the top 1% spend on AI
Source: Schwab Center for Financial Research and Ramp.
Data as of 10/28/2026. Monthly data from October 2023 through September 2026.
Transaction data from 85,000 firms on Ramp, including corporate card and invoice/ACH payments. AI spend includes LLM subscriptions, coding agent subscriptions, API tokens, and GPU cloud and infrastructure spend.
Signpost 4: AI payoff and monetization
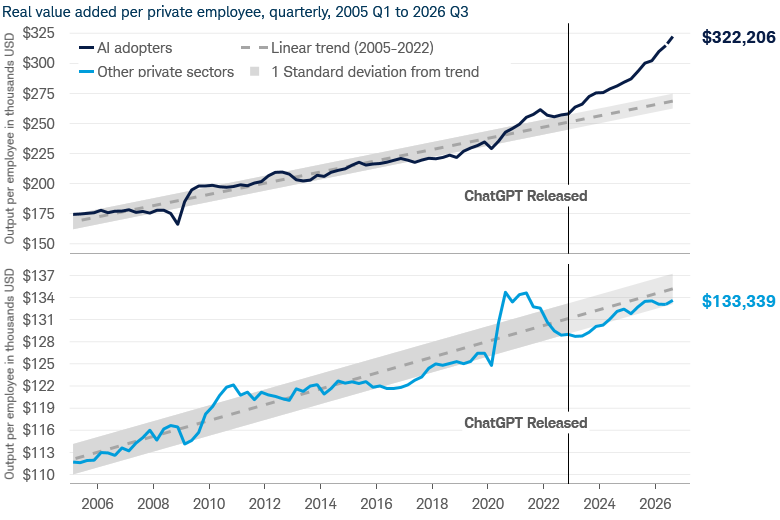
Economic payoff, or monetization, is the hardest signpost to measure because adoption is early and investment occurs well before returns. Broad evidence of higher productivity or revenue remains limited beyond early applications, such as AI-assisted coding. In prior innovation cycles, profits from new technology didn't always accrue to those who put up the most investment capital.
Rising hyperscaler and model-provider margins would indicate improving returns on invested capital. Falling margins could signal higher costs or weak revenue, although margins could temporarily decline as new use cases and applications for the technology develop with a lag. Monetization is needed for investors to be repaid and for companies to be able to reinvest in capacity, models, and applications.
What we're watching to determine the trend and direction of the AI payoff and monetization signpost: Cloud service provider backlogs and remaining performance obligations (RPO) which are a measure of contracted future revenues not yet recognized to third parties; hyperscaler and model-provider margins; productivity, margins, and earnings estimates of adopters; off-balance sheet lease and purchase commitments; and RPO growth relative to capex and off-balance-sheet obligations.
Output per worker in the highest AI adoption sectors has accelerated
Source: Schwab Center for Financial Research, U.S. Bureau of Economic Analysis (BEA).
Quarterly data from January 1, 2005 to September 30, 2026. AI Adopters = information; finance, insurance, real estate, rental, and leasing; and professional and business services. Other private = all private industries excluding these AI adopters and farms. Real value added (chained dollars) divided by payroll employment. Standard deviation measures the dispersion of data points relative to their mean, indicating how spread out data points are from average.
Translating the scenarios into a global equity framework
The investment stage of the cycle has created opportunities to the providers of chips, data centers, and power in the U.S. and emerging markets (EM), as well as select companies in Japan and Europe. In emerging markets, Taiwan and South Korea together comprise almost half of the EM index according to MSCI. Over time, leadership could shift to businesses that successfully use AI to increase productivity, expand margins, or create new sources of revenue. Changes in trends within signposts and signs of durability or vulnerabilities to earnings and corporate health will be important to monitor. As scenario probabilities change over time, equity market leadership may vary.
Regional exposures
| Region/market | Industries and market exposure | Key signposts to monitor |
|---|---|---|
| U.S. | Hyperscalers, cloud service providers, frontier (proprietary) models, semiconductors, memory, equipment, electrical power producers, engineering and construction services, and capital markets. High market weight in AI-related enablers. | Monetization, capex discipline, power contracts, credit issuance, completed data center construction, pricing power, and earnings breadth. |
| Japan/Europe | Equipment, automation, memory, electrical and grid infrastructure, and capital markets. Lower equity market exposure vs. other markets. | Orders, exports, backlog, power investment, and adoption. |
| Taiwan/South Korea | Foundry, advanced packaging and test equipment, and high bandwidth memory (HBM). High market weight in AI-related enablers. | Utilization, pricing, inventories, exports, and customer concentration. |
| China | Domestic open-weight models, automation, electrical equipment and parts, and semiconductors. Profits have been slow to develop, resulting in low market exposure. | Accelerator access, capex, model pricing, adoption, monetization, policy, and exports. |
Select industry exposures
| Sector / industry | Signs of durability | Signs of vulnerability |
|---|---|---|
| Semiconductors and equipment | Orders, utilization, HBM/packaging, and lead times. | Inventory, obsolescence, export controls, pricing, capex digestion, and technological change. |
| Hyperscalers and cloud service providers | AI and cloud revenue, utilization, and token cost efficiency. | Capex/operating cash flow gap (FCF), depreciation, power, and lower-cost open-weight models. |
| Software and applications | Paid usage, AI tier of subscriptions, and customer ROIC. | Commoditization, inference cost, competition, and willingness to pay. |
| Data centers, utilities and industrials | Preleasing, secured power, grid and equipment orders. | Project delays, financing cost, access to labor, stranded assets, and community backlash. |
| Financials and professional services | Financing and underwriting fees, and AI-enabled productivity. | Credit concentration, pricing power, and labor transition. |
| Health care, consumer, and media | Workflow, AI-enabled research, personalization, and productivity. | Validation, privacy, intellectual property, differentiation, and regulation. |
What would change our view?
Evidence of broad paid usage, accelerating AI revenue, rising adopter margins, and measurable productivity would move our outlook toward a productivity boom. Slower than expected adoption, increased ability to finance capex—either through internally generated cash flow or via capital markets—and a lag in monetization would suggest a delayed payoff. Persistent bottlenecks, inflation and higher real yields would favor an inflationary boom. Weak utilization, widening spreads, cancellations, and impairments would signal that the capital structure is breaking before the technology adoption thesis plays out in a deflationary bust scenario. Until one of these patterns becomes decisive, we believe either a delayed payoff or inflationary boom are the most likely scenarios, but the U.S. midterm election outcome has raised the probability of a delayed payoff and a deflationary bust.
The bottom line
The AI investment cycle remains in its early stages, and its ultimate path is far from certain. Demand is still outpacing supply in parts of the AI ecosystem, but history shows that infrastructure booms can eventually produce excess capacity because spending decisions are made well before projects become operational and generate returns. AI may deliver substantial long-term advancements to society even if some of the companies funding today's buildout fail to earn an adequate return on that investment.
The U.S. midterm election outcome has added a new source of uncertainty to the AI cycle, with regulation and growing opposition to data center development potentially slowing the pace of investment and adoption. In our view, these risks, alongside market weakness in semiconductor and AI supply chain equities, raise the probability of a delayed payoff and a deflationary bust relative to our other scenarios.
For investors, this uncertainty reinforces the importance of diversification and selectivity. The companies and markets profiting from the initial surge in capital spending may not be the same ones that ultimately capture the greatest economic value. Leadership could shift from the providers of chips, data centers, power, and financing toward businesses that successfully use AI to increase productivity, expand margins, or create new sources of revenue.
Taken together, the signposts we've identified can help investors assess how the AI cycle is evolving. Conditions can change quickly; what looks like a roadblock, capacity shortfall, or slowdown has, at various points in this cycle, turned into renewed acceleration within weeks or months. A single month of data is unlikely to represent a durable trend. Rather than focusing on any one indicator, investors may want to watch whether the evidence across the signposts of capital spending, financing, adoption, and monetization increasingly points in the same direction.
Heather O'Leary, Senior Manager, Equity Research and Strategy, contributed to this report.
About the authors

Chris Ferrarone